|
Download Data (XLS File) |
|
||||||||
|
||||||||
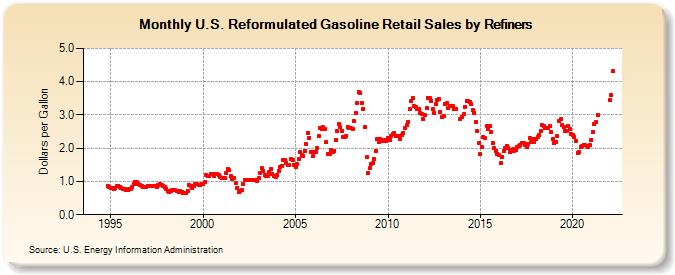
| U.S. Reformulated Gasoline Retail Sales by Refiners (Dollars per Gallon) | ||||||||
| Year | Jan | Feb | Mar | Apr | May | Jun | Jul | Aug | Sep | Oct | Nov | Dec |
|---|---|---|---|---|---|---|---|---|---|---|---|---|
| 1994 | - | - | - | - | - | - | - | - | - | - | 0.872 | 0.821 |
| 1995 | 0.815 | 0.799 | 0.785 | 0.806 | 0.857 | 0.871 | 0.844 | 0.805 | 0.781 | 0.771 | 0.750 | 0.754 |
| 1996 | 0.771 | 0.777 | 0.820 | 0.922 | 0.996 | 0.973 | 0.931 | 0.888 | 0.860 | 0.848 | 0.846 | 0.846 |
| 1997 | 0.870 | 0.873 | 0.866 | 0.875 | 0.872 | 0.856 | 0.841 | 0.895 | 0.926 | 0.904 | 0.872 | 0.836 |
| 1998 | 0.784 | 0.722 | 0.674 | 0.704 | 0.757 | 0.746 | 0.730 | 0.712 | 0.697 | 0.700 | 0.687 | 0.664 |
| 1999 | 0.661 | 0.640 | 0.724 | 0.903 | 0.871 | 0.814 | 0.850 | 0.928 | 0.925 | 0.906 | 0.907 | 0.933 |
| 2000 | 0.938 | 0.998 | 1.185 | 1.174 | 1.153 | 1.221 | 1.230 | 1.177 | 1.238 | 1.221 | 1.200 | 1.134 |
| 2001 | 1.109 | 1.115 | 1.117 | 1.239 | 1.386 | 1.332 | 1.159 | 1.072 | 1.115 | 0.964 | 0.810 | 0.691 |
| 2002 | 0.713 | 0.751 | 0.913 | 1.051 | 1.047 | 1.046 | 1.043 | 1.049 | 1.043 | 1.048 | 1.055 | 1.017 |
| 2003 | 1.097 | 1.256 | 1.394 | 1.320 | 1.199 | 1.160 | 1.157 | 1.291 | 1.375 | 1.234 | 1.165 | 1.122 |
| 2004 | 1.205 | 1.329 | 1.432 | 1.473 | 1.634 | 1.641 | 1.561 | 1.509 | 1.508 | 1.672 | 1.650 | 1.494 |
| 2005 | 1.426 | 1.514 | 1.676 | 1.871 | 1.804 | 1.775 | 1.930 | 2.140 | 2.465 | 2.305 | 1.888 | 1.751 |
| 2006 | 1.900 | 1.894 | 2.008 | 2.376 | 2.605 | 2.566 | 2.634 | 2.564 | 2.173 | 1.837 | 1.826 | 1.932 |
| 2007 | 1.878 | 1.927 | 2.252 | 2.505 | 2.726 | 2.625 | 2.526 | 2.345 | 2.337 | 2.378 | 2.643 | 2.605 |
| 2008 | 2.604 | 2.582 | 2.824 | 3.045 | 3.355 | 3.691 | 3.657 | 3.345 | 3.178 | 2.647 | 1.720 | 1.258 |
| 2009 | 1.394 | 1.537 | 1.549 | 1.673 | 1.907 | 2.263 | 2.171 | 2.270 | 2.251 | 2.212 | 2.257 | 2.221 |
| 2010 | 2.320 | 2.253 | 2.364 | 2.428 | 2.442 | 2.356 | 2.354 | 2.355 | 2.279 | 2.390 | 2.463 | 2.593 |
| 2011 | 2.686 | 2.796 | 3.167 | 3.431 | 3.515 | 3.283 | 3.232 | 3.190 | 3.191 | 3.066 | 3.017 | 2.872 |
| 2012 | 2.986 | 3.198 | 3.505 | 3.497 | 3.425 | 3.164 | 3.059 | 3.322 | 3.435 | 3.472 | 3.095 | 2.925 |
| 2013 | 2.962 | 3.337 | 3.349 | 3.206 | 3.261 | 3.269 | 3.260 | 3.174 | 3.178 | NA | NA | 2.869 |
| 2014 | 2.925 | 3.020 | 3.246 | 3.421 | 3.415 | 3.399 | 3.315 | 3.159 | 3.070 | 2.794 | 2.502 | 2.170 |
| 2015 | 1.824 | 2.022 | 2.346 | 2.308 | 2.662 | 2.585 | 2.660 | 2.501 | 2.155 | 2.007 | 1.905 | 1.840 |
| 2016 | 1.790 | 1.553 | 1.736 | 1.921 | 2.011 | 2.078 | 1.998 | 1.885 | 1.931 | 1.962 | 1.928 | 1.958 |
| 2017 | 2.043 | 2.053 | 2.100 | 2.153 | 2.148 | 2.091 | 2.037 | 2.117 | 2.309 | 2.191 | 2.279 | 2.183 |
| 2018 | 2.274 | 2.347 | 2.385 | 2.510 | 2.682 | 2.668 | 2.615 | 2.593 | 2.610 | 2.672 | 2.487 | 2.278 |
| 2019 | 2.149 | 2.192 | 2.359 | 2.808 | 2.871 | 2.685 | 2.630 | 2.529 | 2.516 | 2.671 | 2.578 | 2.429 |
| 2020 | 2.402 | 2.350 | 2.211 | 1.862 | 1.883 | 2.021 | 2.056 | 2.089 | 2.087 | 2.064 | 2.036 | 2.094 |
| 2021 | 2.251 | 2.473 | 2.724 | 2.799 | 2.998 | W | W | W | W | W | W | W |
| 2022 | 3.438 | 3.592 | 4.328 | |||||||||
| - = No Data Reported; -- = Not Applicable; NA = Not Available; W = Withheld to avoid disclosure of individual company data. |
| Release Date: 6/1/2022 |
| Next Release Date: TBD |