|
Download Data (XLS File) |
|
||||||||
|
||||||||
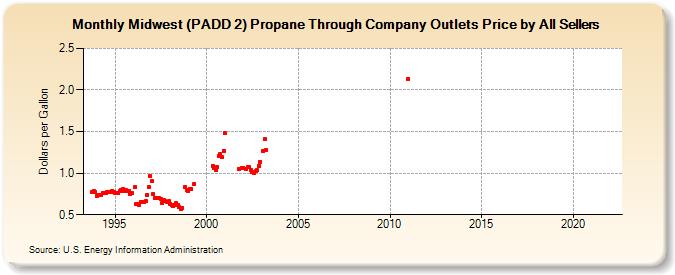
| Midwest (PADD 2) Propane Through Company Outlets Price by All Sellers (Dollars per Gallon) | ||||||||
| Year | Jan | Feb | Mar | Apr | May | Jun | Jul | Aug | Sep | Oct | Nov | Dec |
|---|---|---|---|---|---|---|---|---|---|---|---|---|
| 1993 | 0.769 | 0.787 | 0.774 | |||||||||
| 1994 | 0.726 | 0.735 | 0.739 | 0.740 | 0.763 | 0.765 | 0.766 | 0.774 | 0.772 | 0.776 | 0.790 | 0.775 |
| 1995 | 0.757 | 0.764 | 0.767 | 0.783 | 0.802 | 0.804 | 0.785 | 0.797 | 0.780 | 0.783 | 0.752 | 0.757 |
| 1996 | NA | 0.832 | 0.633 | 0.623 | 0.619 | 0.653 | 0.648 | 0.652 | 0.661 | 0.738 | 0.839 | 0.964 |
| 1997 | 0.900 | 0.746 | 0.702 | 0.698 | 0.701 | 0.703 | 0.693 | 0.642 | 0.679 | 0.661 | 0.658 | 0.659 |
| 1998 | 0.632 | 0.613 | 0.601 | 0.622 | 0.637 | 0.618 | 0.593 | 0.573 | 0.581 | NA | 0.828 | 0.803 |
| 1999 | 0.784 | 0.815 | 0.809 | W | 0.871 | W | W | W | W | W | W | W |
| 2000 | W | W | W | W | 1.091 | 1.060 | 1.041 | 1.073 | 1.209 | 1.229 | 1.188 | 1.267 |
| 2001 | 1.477 | W | W | W | W | W | W | W | W | 1.050 | W | 1.063 |
| 2002 | 1.064 | NA | 1.044 | 1.068 | 1.072 | 1.040 | 1.013 | 1.001 | 1.021 | 1.036 | 1.083 | 1.137 |
| 2003 | W | 1.265 | 1.405 | 1.279 | W | W | W | W | W | W | W | W |
| 2004 | W | W | W | W | W | W | W | W | W | W | W | W |
| 2005 | W | W | W | W | W | W | W | W | W | W | W | W |
| 2006 | W | W | W | W | W | W | W | W | W | W | W | W |
| 2007 | W | W | W | W | W | W | W | W | W | W | W | W |
| 2008 | W | W | W | W | W | W | W | W | W | W | W | W |
| 2009 | W | W | W | W | W | W | W | W | W | W | W | W |
| 2010 | W | W | W | W | W | W | W | W | W | W | W | W |
| 2011 | 2.135 | W | - | - | - | - | - | - | - | - | - | - |
| 2012 | - | - | - | - | - | - | - | - | - | - | - | - |
| 2013 | - | - | - | - | - | - | - | - | - | - | - | - |
| 2014 | - | - | - | - | - | - | - | - | - | - | - | - |
| 2015 | - | - | - | - | - | - | - | - | - | - | - | - |
| 2016 | - | - | - | - | - | - | - | - | - | - | - | - |
| 2017 | - | - | - | - | - | - | - | - | - | - | - | - |
| 2018 | - | - | - | - | - | - | - | - | - | - | - | - |
| 2019 | - | - | - | - | - | - | - | - | - | - | - | |
| 2020 | - | - | - | - | - | - | - | - | - | - | - | - |
| 2021 | - | - | - | - | - | - | - | - | - | - | - | - |
| 2022 | - | - | - | |||||||||
| - = No Data Reported; -- = Not Applicable; NA = Not Available; W = Withheld to avoid disclosure of individual company data. |
| Release Date: 6/1/2022 |
| Next Release Date: TBD |