|
Download Data (XLS File) |
|
||||||||
|
||||||||
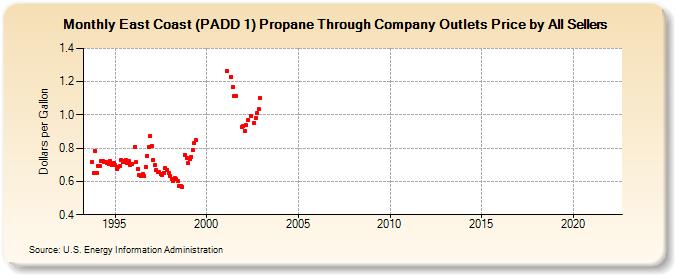
| East Coast (PADD 1) Propane Through Company Outlets Price by All Sellers (Dollars per Gallon) | ||||||||
| Year | Jan | Feb | Mar | Apr | May | Jun | Jul | Aug | Sep | Oct | Nov | Dec |
|---|---|---|---|---|---|---|---|---|---|---|---|---|
| 1993 | 0.717 | 0.650 | 0.784 | |||||||||
| 1994 | 0.649 | 0.691 | 0.694 | 0.724 | 0.722 | 0.718 | 0.719 | 0.711 | 0.703 | 0.724 | 0.700 | 0.710 |
| 1995 | 0.698 | 0.676 | 0.687 | 0.692 | 0.726 | 0.715 | 0.722 | 0.727 | 0.713 | 0.722 | 0.699 | 0.706 |
| 1996 | NA | 0.806 | 0.715 | 0.676 | 0.637 | 0.634 | 0.642 | 0.632 | 0.688 | 0.756 | 0.805 | 0.875 |
| 1997 | 0.816 | 0.731 | 0.698 | 0.670 | 0.656 | 0.655 | 0.643 | 0.637 | 0.650 | 0.681 | 0.670 | 0.650 |
| 1998 | 0.633 | 0.615 | 0.600 | 0.619 | 0.616 | 0.605 | 0.575 | 0.570 | 0.567 | NA | 0.762 | 0.742 |
| 1999 | 0.708 | 0.734 | 0.748 | 0.788 | 0.831 | 0.847 | W | W | W | W | W | W |
| 2000 | W | W | W | W | W | W | W | W | W | W | W | W |
| 2001 | W | 1.267 | W | W | 1.230 | 1.170 | 1.112 | 1.115 | W | W | W | 0.928 |
| 2002 | 0.931 | 0.906 | 0.938 | 0.969 | W | 0.995 | W | 0.954 | 0.981 | 1.010 | 1.035 | 1.103 |
| 2003 | W | W | W | W | W | W | W | W | W | W | W | W |
| 2004 | W | W | W | W | W | W | W | W | W | W | W | W |
| 2005 | W | W | W | W | W | W | W | W | W | W | W | W |
| 2006 | W | W | W | W | W | W | W | W | W | W | W | W |
| 2007 | W | W | W | W | W | W | W | W | W | W | W | W |
| 2008 | W | W | W | W | W | W | W | W | W | W | W | W |
| 2009 | W | W | W | W | W | W | W | W | W | W | W | W |
| 2010 | W | W | W | W | W | W | W | W | W | W | W | W |
| 2011 | W | W | - | - | - | - | - | - | - | - | - | - |
| 2012 | - | - | - | - | - | - | - | - | - | - | - | - |
| 2013 | - | - | - | - | - | - | - | - | - | - | - | - |
| 2014 | - | - | - | - | - | - | - | - | - | - | - | - |
| 2015 | - | - | - | - | - | - | - | - | - | - | - | - |
| 2016 | - | - | - | - | - | - | - | - | - | - | - | - |
| 2017 | - | - | - | - | - | - | - | - | - | - | - | - |
| 2018 | - | - | - | - | - | - | - | - | - | - | - | - |
| 2019 | - | - | - | - | - | - | - | - | - | - | - | |
| 2020 | - | - | - | - | - | - | - | - | - | - | - | - |
| 2021 | - | - | - | - | - | - | - | - | - | - | - | - |
| 2022 | - | - | - | |||||||||
| - = No Data Reported; -- = Not Applicable; NA = Not Available; W = Withheld to avoid disclosure of individual company data. |
| Release Date: 6/1/2022 |
| Next Release Date: TBD |