|
Download Data (XLS File) |
|
||||||||
|
||||||||
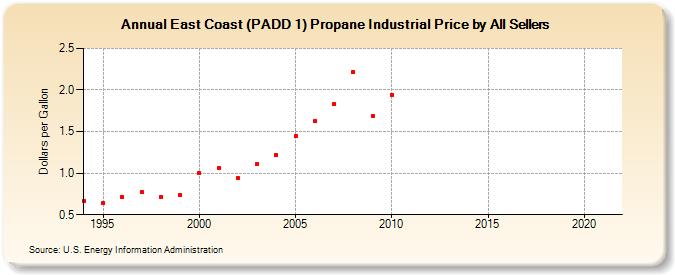
| East Coast (PADD 1) Propane Industrial Price by All Sellers (Dollars per Gallon) | ||||||||
| Decade | Year-0 | Year-1 | Year-2 | Year-3 | Year-4 | Year-5 | Year-6 | Year-7 | Year-8 | Year-9 |
|---|---|---|---|---|---|---|---|---|---|---|
| 1990's | 0.669 | 0.636 | 0.711 | 0.777 | 0.710 | 0.741 | ||||
| 2000's | 0.996 | 1.060 | 0.941 | 1.105 | 1.221 | 1.445 | 1.626 | 1.833 | 2.216 | 1.686 |
| 2010's | 1.945 | - | - | - | - | - | - | - | - | - |
| 2020's | - |
| - = No Data Reported; -- = Not Applicable; NA = Not Available; W = Withheld to avoid disclosure of individual company data. |
| Release Date: 6/1/2022 |
| Next Release Date: TBD |