|
Download Data (XLS File) |
|
||||||||
|
||||||||
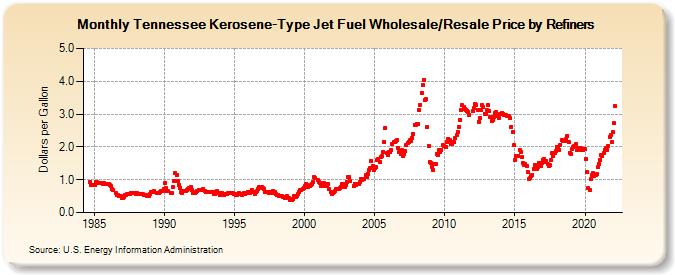
| Tennessee Kerosene-Type Jet Fuel Wholesale/Resale Price by Refiners (Dollars per Gallon) | ||||||||
| Year | Jan | Feb | Mar | Apr | May | Jun | Jul | Aug | Sep | Oct | Nov | Dec |
|---|---|---|---|---|---|---|---|---|---|---|---|---|
| 1984 | 0.931 | 0.848 | 0.847 | 0.835 | ||||||||
| 1985 | 0.845 | 0.919 | 0.920 | 0.903 | 0.914 | 0.895 | 0.894 | 0.870 | 0.892 | 0.875 | 0.858 | 0.882 |
| 1986 | 0.876 | 0.833 | 0.805 | 0.709 | 0.675 | W | 0.595 | 0.529 | 0.523 | 0.519 | 0.513 | 0.436 |
| 1987 | 0.437 | 0.461 | 0.535 | 0.545 | 0.557 | 0.559 | 0.575 | 0.602 | 0.591 | 0.603 | 0.609 | 0.573 |
| 1988 | 0.592 | 0.573 | 0.560 | 0.560 | 0.557 | 0.555 | 0.534 | 0.539 | 0.530 | 0.510 | 0.511 | 0.552 |
| 1989 | 0.612 | 0.627 | 0.618 | 0.644 | W | 0.602 | 0.587 | 0.588 | 0.622 | 0.670 | 0.670 | 0.721 |
| 1990 | 0.890 | 0.737 | 0.668 | 0.642 | W | 0.602 | 0.581 | 0.769 | 0.955 | 1.197 | 1.140 | 0.968 |
| 1991 | 0.850 | 0.760 | 0.633 | 0.607 | 0.649 | 0.644 | 0.646 | 0.692 | 0.722 | 0.743 | 0.773 | 0.686 |
| 1992 | 0.587 | 0.627 | 0.604 | 0.616 | 0.662 | 0.692 | 0.690 | 0.688 | 0.696 | 0.712 | 0.670 | 0.628 |
| 1993 | 0.630 | 0.625 | 0.640 | 0.639 | 0.639 | 0.628 | 0.580 | 0.580 | 0.614 | 0.656 | 0.607 | 0.548 |
| 1994 | 0.576 | 0.602 | 0.553 | 0.532 | 0.560 | 0.578 | 0.587 | 0.599 | 0.582 | 0.586 | 0.605 | 0.579 |
| 1995 | 0.564 | 0.548 | 0.533 | 0.566 | 0.585 | 0.571 | 0.540 | 0.566 | 0.586 | 0.580 | 0.596 | 0.618 |
| 1996 | 0.630 | 0.596 | 0.630 | 0.680 | 0.628 | 0.580 | 0.614 | 0.662 | 0.728 | 0.785 | 0.762 | 0.774 |
| 1997 | 0.752 | 0.714 | 0.636 | 0.616 | 0.619 | 0.606 | 0.604 | 0.641 | 0.607 | 0.647 | 0.638 | 0.572 |
| 1998 | 0.548 | 0.540 | 0.493 | 0.500 | 0.502 | 0.463 | 0.461 | 0.449 | 0.473 | 0.491 | 0.457 | 0.397 |
| 1999 | 0.390 | 0.380 | 0.417 | 0.499 | 0.487 | 0.490 | 0.563 | 0.616 | 0.673 | 0.699 | 0.710 | 0.741 |
| 2000 | 0.811 | 0.876 | 0.853 | 0.790 | 0.815 | 0.835 | 0.871 | 0.922 | 1.089 | 1.045 | NA | 0.999 |
| 2001 | 0.933 | 0.902 | 0.824 | 0.821 | 0.894 | 0.871 | 0.799 | 0.844 | 0.855 | 0.705 | 0.626 | 0.566 |
| 2002 | 0.609 | 0.630 | 0.671 | 0.712 | 0.731 | 0.721 | 0.752 | 0.787 | 0.860 | 0.872 | 0.778 | 0.836 |
| 2003 | 0.939 | 1.079 | 1.089 | 0.954 | W | W | 0.807 | 0.873 | 0.849 | 0.864 | 0.880 | 0.916 |
| 2004 | 1.014 | 1.001 | 1.010 | 1.014 | 1.129 | 1.095 | 1.175 | 1.284 | 1.349 | 1.563 | 1.428 | 1.302 |
| 2005 | 1.342 | 1.382 | 1.594 | 1.645 | 1.542 | 1.678 | 1.729 | 1.830 | 2.143 | 2.577 | 1.801 | 1.761 |
| 2006 | 1.855 | 1.835 | 1.907 | 2.077 | 2.146 | 2.152 | 2.183 | 2.213 | 1.962 | 1.837 | 1.778 | 1.899 |
| 2007 | 1.724 | 1.782 | 1.863 | 2.055 | 2.116 | 2.146 | 2.195 | 2.166 | 2.277 | 2.392 | 2.673 | 2.676 |
| 2008 | 2.710 | 2.691 | 3.122 | 3.284 | 3.653 | 3.889 | 4.044 | 3.435 | 3.448 | 2.608 | 2.034 | 1.551 |
| 2009 | 1.507 | 1.393 | 1.295 | 1.474 | 1.494 | 1.796 | 1.767 | 1.912 | 1.830 | 1.910 | 2.053 | 2.016 |
| 2010 | W | 2.004 | 2.143 | 2.254 | 2.196 | 2.088 | 2.080 | 2.146 | 2.138 | 2.274 | 2.353 | 2.453 |
| 2011 | 2.611 | 2.820 | 3.136 | 3.267 | 3.211 | 3.148 | 3.111 | 3.097 | 3.067 | 2.972 | W | W |
| 2012 | 3.081 | 3.192 | 3.318 | 3.291 | 3.127 | 2.772 | 2.874 | 3.114 | 3.270 | 3.201 | 3.013 | 2.999 |
| 2013 | 3.122 | 3.270 | 3.090 | 2.916 | 2.795 | 2.823 | 2.918 | 3.026 | 3.068 | 2.944 | 2.888 | 3.006 |
| 2014 | 3.004 | 3.037 | 3.006 | 2.958 | 2.957 | 2.942 | 2.928 | 2.926 | 2.871 | 2.614 | 2.441 | 2.044 |
| 2015 | 1.607 | 1.713 | 1.735 | 1.716 | 1.915 | 1.837 | 1.680 | 1.511 | 1.454 | 1.465 | 1.428 | 1.233 |
| 2016 | 1.017 | 1.040 | 1.112 | 1.157 | 1.338 | 1.457 | 1.381 | 1.322 | 1.399 | 1.500 | 1.431 | 1.513 |
| 2017 | 1.602 | 1.626 | 1.550 | 1.569 | 1.475 | 1.406 | 1.436 | 1.593 | 1.827 | 1.734 | 1.811 | 1.865 |
| 2018 | 2.010 | 1.958 | 1.917 | 2.055 | 2.213 | 2.177 | 2.168 | 2.177 | 2.250 | 2.336 | 2.135 | 1.829 |
| 2019 | 1.795 | 1.944 | 1.988 | 2.023 | 2.073 | 1.914 | 1.980 | 1.907 | 1.920 | 1.958 | 1.910 | 1.939 |
| 2020 | 1.933 | 1.630 | 1.228 | 0.737 | 0.701 | 1.017 | 1.144 | 1.194 | 1.122 | 1.134 | 1.167 | 1.381 |
| 2021 | 1.478 | 1.610 | 1.767 | 1.708 | 1.809 | 1.912 | 1.962 | 1.917 | 2.032 | 2.311 | 2.351 | 2.156 |
| 2022 | 2.442 | 2.715 | 3.241 | |||||||||
| - = No Data Reported; -- = Not Applicable; NA = Not Available; W = Withheld to avoid disclosure of individual company data. |
| Release Date: 6/1/2022 |
| Next Release Date: TBD |