|
Download Data (XLS File) |
|
||||||||
|
||||||||
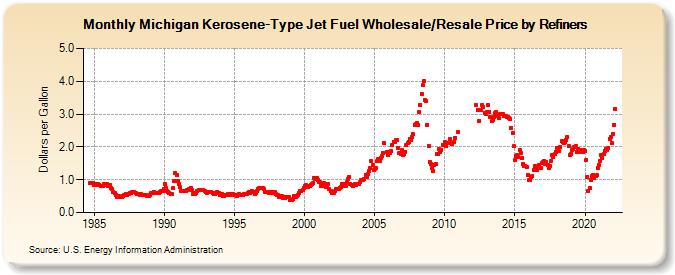
| Michigan Kerosene-Type Jet Fuel Wholesale/Resale Price by Refiners (Dollars per Gallon) | ||||||||
| Year | Jan | Feb | Mar | Apr | May | Jun | Jul | Aug | Sep | Oct | Nov | Dec |
|---|---|---|---|---|---|---|---|---|---|---|---|---|
| 1984 | 0.894 | 0.889 | 0.887 | 0.842 | ||||||||
| 1985 | 0.860 | 0.851 | 0.856 | 0.860 | 0.852 | 0.822 | 0.800 | 0.811 | 0.856 | 0.848 | 0.863 | 0.818 |
| 1986 | 0.853 | 0.836 | 0.744 | 0.707 | 0.628 | 0.599 | 0.521 | 0.488 | 0.483 | 0.495 | 0.479 | 0.478 |
| 1987 | 0.514 | 0.533 | 0.544 | 0.563 | 0.541 | 0.568 | 0.597 | 0.595 | 0.623 | 0.613 | 0.622 | 0.598 |
| 1988 | 0.575 | 0.571 | 0.556 | 0.550 | 0.552 | 0.549 | 0.534 | 0.538 | 0.524 | 0.497 | 0.512 | 0.531 |
| 1989 | 0.589 | 0.603 | 0.594 | 0.616 | 0.606 | 0.588 | 0.581 | 0.585 | 0.615 | 0.654 | 0.662 | 0.711 |
| 1990 | 0.856 | 0.752 | 0.650 | 0.619 | 0.603 | 0.577 | 0.580 | 0.744 | 0.956 | 1.197 | 1.137 | 0.961 |
| 1991 | 0.860 | 0.766 | 0.665 | 0.646 | 0.663 | 0.652 | 0.648 | 0.684 | 0.699 | 0.722 | 0.755 | 0.679 |
| 1992 | 0.579 | 0.598 | 0.564 | 0.593 | 0.657 | 0.686 | 0.692 | 0.674 | 0.683 | 0.692 | 0.659 | 0.619 |
| 1993 | 0.610 | 0.619 | 0.637 | 0.627 | 0.624 | 0.598 | 0.568 | 0.568 | 0.583 | 0.629 | 0.605 | 0.525 |
| 1994 | 0.545 | 0.572 | 0.509 | 0.517 | 0.524 | 0.545 | 0.565 | 0.563 | 0.547 | 0.554 | 0.564 | 0.546 |
| 1995 | 0.533 | 0.521 | 0.513 | 0.538 | 0.563 | 0.545 | 0.521 | 0.541 | 0.570 | 0.552 | 0.577 | 0.597 |
| 1996 | 0.620 | 0.584 | 0.611 | 0.662 | 0.623 | 0.573 | 0.605 | 0.654 | 0.725 | 0.758 | 0.752 | 0.761 |
| 1997 | 0.740 | 0.707 | 0.632 | 0.613 | 0.612 | 0.594 | 0.595 | 0.619 | 0.598 | 0.622 | 0.620 | 0.566 |
| 1998 | 0.534 | 0.526 | 0.477 | 0.493 | 0.497 | 0.458 | 0.465 | 0.443 | 0.464 | 0.489 | 0.463 | 0.379 |
| 1999 | 0.378 | 0.377 | 0.400 | 0.497 | 0.486 | 0.499 | 0.529 | 0.610 | 0.655 | 0.650 | 0.685 | 0.734 |
| 2000 | 0.812 | 0.831 | 0.823 | 0.782 | 0.809 | 0.842 | 0.876 | 0.900 | 1.055 | 1.034 | 1.062 | 1.004 |
| 2001 | 0.925 | 0.916 | 0.820 | 0.821 | 0.893 | 0.863 | 0.789 | 0.816 | 0.871 | 0.725 | 0.644 | 0.592 |
| 2002 | 0.589 | 0.601 | 0.654 | 0.729 | 0.728 | 0.705 | 0.760 | 0.778 | 0.878 | 0.879 | 0.805 | 0.813 |
| 2003 | 0.918 | 1.036 | 1.092 | 0.876 | 0.828 | 0.812 | 0.848 | 0.876 | 0.825 | 0.869 | 0.884 | 0.916 |
| 2004 | 0.986 | 0.993 | 0.992 | 1.013 | 1.145 | 1.092 | 1.172 | 1.267 | 1.343 | 1.569 | 1.443 | 1.310 |
| 2005 | 1.340 | 1.360 | 1.573 | 1.631 | 1.566 | 1.673 | 1.723 | 1.828 | 2.110 | NA | 1.856 | 1.754 |
| 2006 | 1.837 | 1.822 | 1.882 | 2.064 | 2.151 | 2.161 | 2.198 | 2.208 | 1.977 | 1.814 | 1.783 | 1.900 |
| 2007 | 1.748 | 1.779 | 1.857 | 2.057 | 2.109 | 2.161 | 2.247 | 2.212 | 2.306 | 2.379 | 2.677 | 2.693 |
| 2008 | 2.722 | 2.678 | 3.064 | 3.289 | 3.620 | 3.891 | 4.005 | 3.436 | 3.390 | 2.675 | 2.032 | 1.555 |
| 2009 | 1.471 | 1.369 | 1.271 | 1.461 | 1.475 | 1.787 | 1.780 | 1.931 | 1.852 | 1.909 | 2.067 | W |
| 2010 | 2.134 | 2.020 | 2.133 | W | 2.230 | 2.107 | 2.099 | W | 2.160 | 2.280 | W | 2.450 |
| 2011 | W | W | W | W | W | W | W | W | W | W | W | W |
| 2012 | W | W | W | 3.282 | 3.129 | 2.781 | NA | 3.122 | 3.277 | 3.209 | 3.031 | 3.000 |
| 2013 | 3.076 | 3.277 | 3.055 | 2.907 | 2.780 | 2.824 | 2.905 | 3.020 | 3.054 | 2.935 | 2.870 | 2.993 |
| 2014 | 2.991 | 3.001 | 2.993 | 2.939 | 2.940 | 2.919 | 2.908 | 2.889 | 2.848 | 2.584 | 2.411 | 2.016 |
| 2015 | 1.599 | 1.712 | 1.744 | 1.696 | 1.903 | 1.821 | 1.658 | 1.490 | 1.404 | 1.425 | 1.374 | 1.154 |
| 2016 | 0.982 | 0.988 | 1.087 | 1.128 | 1.299 | 1.415 | 1.322 | 1.302 | 1.356 | 1.463 | 1.360 | 1.501 |
| 2017 | 1.545 | 1.577 | 1.489 | 1.539 | 1.441 | 1.346 | 1.422 | 1.575 | 1.767 | 1.685 | 1.777 | 1.847 |
| 2018 | 1.972 | 1.910 | 1.873 | 2.007 | 2.166 | 2.137 | 2.123 | 2.138 | 2.212 | 2.305 | 2.032 | 1.760 |
| 2019 | 1.782 | 1.910 | 1.949 | 1.993 | 2.021 | 1.849 | 1.936 | 1.849 | 1.889 | 1.905 | 1.857 | 1.911 |
| 2020 | 1.881 | 1.589 | 1.097 | 0.651 | 0.739 | 1.006 | 1.118 | 1.142 | 1.067 | 1.103 | 1.134 | 1.359 |
| 2021 | 1.450 | 1.582 | 1.746 | 1.675 | 1.782 | 1.880 | 1.929 | 1.891 | 1.979 | 2.248 | 2.311 | 2.109 |
| 2022 | 2.404 | 2.680 | 3.164 | |||||||||
| - = No Data Reported; -- = Not Applicable; NA = Not Available; W = Withheld to avoid disclosure of individual company data. |
| Release Date: 6/1/2022 |
| Next Release Date: TBD |