|
Download Data (XLS File) |
|
||||||||
|
||||||||
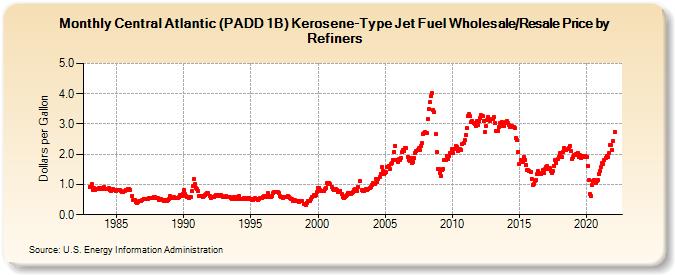
| Central Atlantic (PADD 1B) Kerosene-Type Jet Fuel Wholesale/Resale Price by Refiners (Dollars per Gallon) | ||||||||
| Year | Jan | Feb | Mar | Apr | May | Jun | Jul | Aug | Sep | Oct | Nov | Dec |
|---|---|---|---|---|---|---|---|---|---|---|---|---|
| 1983 | 0.921 | 0.923 | 1.000 | 0.827 | 0.890 | 0.826 | 0.854 | 0.863 | 0.893 | 0.897 | 0.862 | 0.841 |
| 1984 | 0.899 | 0.904 | 0.858 | 0.846 | 0.848 | 0.876 | 0.828 | 0.792 | 0.822 | 0.841 | 0.828 | 0.798 |
| 1985 | 0.810 | 0.809 | 0.801 | 0.809 | 0.782 | 0.749 | 0.758 | 0.774 | 0.820 | 0.833 | 0.860 | 0.850 |
| 1986 | 0.828 | NA | 0.622 | 0.485 | 0.481 | 0.433 | 0.389 | 0.415 | 0.445 | 0.448 | 0.458 | 0.478 |
| 1987 | 0.529 | 0.512 | 0.517 | 0.508 | 0.533 | 0.542 | 0.569 | 0.568 | 0.541 | 0.601 | 0.592 | 0.561 |
| 1988 | 0.550 | 0.537 | 0.503 | 0.518 | 0.516 | 0.502 | 0.467 | 0.476 | 0.489 | 0.464 | 0.479 | 0.532 |
| 1989 | 0.606 | 0.559 | 0.565 | 0.581 | 0.550 | 0.546 | 0.545 | 0.555 | 0.584 | 0.645 | 0.623 | 0.689 |
| 1990 | 0.801 | 0.684 | 0.618 | 0.597 | 0.593 | 0.542 | 0.570 | 0.772 | 0.936 | 1.181 | 1.020 | 0.881 |
| 1991 | 0.839 | 0.768 | 0.634 | 0.607 | 0.605 | 0.592 | 0.610 | 0.651 | 0.669 | 0.703 | 0.705 | 0.609 |
| 1992 | 0.555 | 0.574 | 0.585 | 0.584 | 0.625 | 0.641 | 0.649 | 0.625 | 0.637 | 0.653 | 0.608 | 0.586 |
| 1993 | 0.583 | 0.594 | 0.613 | 0.594 | 0.593 | 0.571 | 0.538 | 0.532 | 0.557 | 0.596 | 0.584 | 0.505 |
| 1994 | 0.575 | 0.617 | 0.516 | 0.506 | 0.511 | 0.520 | 0.543 | 0.544 | 0.525 | 0.538 | 0.545 | 0.528 |
| 1995 | 0.517 | 0.503 | 0.484 | 0.516 | 0.544 | 0.528 | 0.503 | 0.528 | 0.552 | 0.540 | 0.557 | 0.586 |
| 1996 | 0.617 | 0.593 | 0.633 | 0.718 | 0.626 | 0.576 | 0.593 | 0.635 | 0.708 | 0.751 | 0.740 | 0.753 |
| 1997 | 0.738 | 0.708 | 0.610 | 0.602 | 0.587 | 0.565 | 0.575 | 0.598 | 0.588 | 0.608 | 0.601 | 0.544 |
| 1998 | 0.526 | 0.506 | 0.465 | 0.470 | 0.467 | 0.444 | 0.444 | 0.430 | 0.441 | 0.460 | 0.446 | 0.352 |
| 1999 | 0.357 | 0.334 | 0.396 | 0.458 | 0.452 | 0.464 | 0.531 | 0.580 | 0.639 | 0.628 | 0.668 | 0.736 |
| 2000 | 0.876 | 0.897 | 0.832 | 0.776 | 0.786 | 0.795 | 0.841 | 0.889 | 1.041 | 1.023 | 1.050 | 1.001 |
| 2001 | 0.904 | 0.862 | 0.802 | 0.802 | 0.842 | 0.817 | 0.746 | 0.764 | 0.800 | 0.679 | 0.595 | 0.545 |
| 2002 | 0.593 | 0.610 | 0.651 | 0.708 | 0.719 | 0.700 | 0.723 | 0.743 | 0.819 | 0.852 | 0.776 | 0.790 |
| 2003 | 0.918 | 1.109 | NA | 0.814 | 0.781 | 0.781 | 0.826 | 0.866 | 0.807 | 0.847 | 0.881 | 0.928 |
| 2004 | 0.992 | 1.040 | 1.012 | 1.028 | 1.178 | 1.077 | 1.168 | 1.252 | 1.352 | 1.574 | 1.442 | 1.353 |
| 2005 | 1.383 | 1.403 | 1.569 | 1.612 | 1.524 | 1.669 | 1.712 | 1.809 | 2.083 | 2.282 | 1.804 | 1.755 |
| 2006 | 1.833 | 1.793 | 1.888 | 2.061 | 2.126 | 2.117 | 2.195 | 2.213 | 1.918 | 1.807 | 1.777 | 1.875 |
| 2007 | 1.704 | 1.759 | 1.859 | 2.024 | 2.096 | 2.135 | 2.190 | 2.126 | 2.280 | 2.368 | 2.674 | 2.688 |
| 2008 | 2.721 | 2.693 | 3.154 | 3.499 | 3.718 | 3.916 | 4.021 | 3.457 | 3.395 | 2.657 | 2.073 | 1.519 |
| 2009 | 1.521 | 1.388 | 1.296 | 1.463 | 1.526 | 1.824 | 1.808 | 1.954 | 1.841 | 1.926 | 2.049 | 2.039 |
| 2010 | 2.169 | 2.040 | 2.176 | 2.275 | 2.247 | 2.108 | 2.126 | 2.163 | 2.141 | 2.326 | 2.378 | 2.469 |
| 2011 | 2.641 | 2.861 | 3.257 | 3.317 | 3.254 | 3.062 | 3.096 | 3.046 | 3.001 | 2.936 | 3.090 | 2.966 |
| 2012 | 3.089 | 3.185 | 3.284 | 3.257 | 3.107 | 2.747 | 2.918 | 3.133 | 3.215 | 3.174 | 3.092 | NA |
| 2013 | 3.162 | 3.227 | 3.033 | 2.784 | 2.758 | 2.775 | 2.901 | 3.020 | 3.060 | 2.944 | 2.921 | 3.041 |
| 2014 | 3.072 | 3.096 | 3.025 | 2.965 | 2.916 | 2.930 | 2.897 | 2.895 | 2.855 | 2.543 | 2.466 | 2.084 |
| 2015 | 1.672 | 1.818 | 1.798 | 1.736 | 1.903 | 1.818 | 1.652 | 1.465 | 1.468 | 1.450 | 1.409 | 1.196 |
| 2016 | 0.996 | 1.019 | 1.108 | 1.157 | 1.335 | 1.429 | 1.358 | 1.332 | 1.380 | 1.468 | 1.388 | 1.500 |
| 2017 | 1.562 | 1.597 | 1.501 | 1.539 | 1.444 | 1.365 | 1.446 | 1.625 | 1.824 | 1.725 | 1.831 | 1.915 |
| 2018 | 2.034 | 1.939 | 1.899 | 2.065 | 2.216 | 2.148 | 2.148 | 2.159 | 2.207 | 2.288 | 2.111 | 1.827 |
| 2019 | 1.898 | 1.958 | 1.973 | 2.019 | 2.052 | 1.893 | 1.965 | 1.869 | 1.912 | 1.955 | 1.915 | 1.951 |
| 2020 | 1.903 | 1.611 | 1.134 | 0.670 | 0.613 | 0.987 | 1.108 | 1.152 | 1.062 | 1.100 | 1.161 | 1.361 |
| 2021 | 1.460 | 1.573 | 1.715 | 1.682 | 1.809 | 1.887 | 1.948 | 1.901 | 2.025 | 2.309 | 2.302 | 2.135 |
| 2022 | 2.441 | 2.749 | NA | |||||||||
| - = No Data Reported; -- = Not Applicable; NA = Not Available; W = Withheld to avoid disclosure of individual company data. |
| Release Date: 6/1/2022 |
| Next Release Date: TBD |