|
Download Data (XLS File) |
|
||||||||
|
||||||||
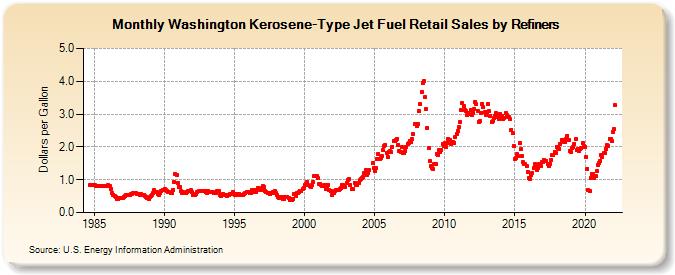
| Washington Kerosene-Type Jet Fuel Retail Sales by Refiners (Dollars per Gallon) | ||||||||
| Year | Jan | Feb | Mar | Apr | May | Jun | Jul | Aug | Sep | Oct | Nov | Dec |
|---|---|---|---|---|---|---|---|---|---|---|---|---|
| 1984 | 0.847 | 0.847 | 0.847 | 0.840 | ||||||||
| 1985 | 0.830 | 0.822 | 0.815 | 0.814 | 0.814 | 0.816 | 0.809 | 0.803 | 0.809 | 0.803 | 0.810 | 0.825 |
| 1986 | 0.824 | 0.798 | 0.728 | 0.600 | 0.548 | 0.494 | 0.460 | 0.427 | 0.406 | 0.434 | 0.434 | 0.437 |
| 1987 | 0.454 | 0.489 | 0.505 | 0.521 | 0.523 | 0.522 | 0.540 | 0.562 | 0.579 | 0.603 | 0.608 | 0.590 |
| 1988 | 0.565 | 0.555 | 0.551 | 0.540 | 0.551 | 0.544 | 0.529 | 0.492 | 0.479 | 0.436 | 0.428 | 0.471 |
| 1989 | 0.502 | 0.546 | 0.601 | 0.674 | 0.641 | 0.613 | 0.560 | 0.549 | 0.594 | 0.660 | 0.684 | 0.687 |
| 1990 | 0.711 | 0.673 | 0.662 | 0.639 | 0.616 | 0.585 | 0.584 | 0.700 | 0.939 | 1.173 | 1.149 | 0.910 |
| 1991 | 0.772 | 0.764 | 0.643 | 0.588 | 0.614 | 0.592 | 0.581 | 0.629 | 0.669 | 0.651 | 0.676 | 0.615 |
| 1992 | 0.535 | 0.536 | 0.549 | 0.578 | 0.635 | 0.642 | 0.653 | 0.647 | 0.642 | 0.667 | 0.652 | 0.612 |
| 1993 | 0.610 | 0.647 | 0.627 | 0.625 | 0.622 | 0.627 | 0.591 | 0.583 | 0.599 | 0.649 | 0.652 | 0.534 |
| 1994 | 0.515 | 0.535 | 0.575 | 0.537 | 0.530 | 0.519 | 0.536 | 0.537 | 0.570 | 0.574 | 0.628 | 0.556 |
| 1995 | 0.538 | 0.560 | 0.548 | 0.554 | 0.572 | 0.543 | 0.545 | 0.549 | 0.575 | 0.592 | 0.614 | 0.626 |
| 1996 | 0.633 | 0.586 | 0.581 | 0.687 | 0.697 | 0.614 | 0.633 | 0.684 | 0.752 | 0.716 | 0.702 | 0.747 |
| 1997 | 0.807 | 0.784 | 0.652 | 0.630 | 0.599 | 0.583 | 0.552 | 0.586 | 0.594 | 0.636 | 0.642 | 0.595 |
| 1998 | 0.534 | 0.484 | 0.437 | 0.467 | 0.471 | 0.412 | 0.423 | 0.467 | 0.459 | 0.475 | 0.446 | 0.395 |
| 1999 | 0.415 | 0.382 | 0.410 | 0.551 | 0.504 | 0.606 | 0.601 | 0.636 | 0.662 | 0.669 | 0.708 | 0.749 |
| 2000 | 0.852 | 0.856 | 0.935 | 0.831 | 0.800 | 0.793 | 0.846 | 0.924 | 1.116 | 1.117 | 1.117 | 1.039 |
| 2001 | 0.869 | 0.870 | 0.845 | 0.811 | 0.819 | 0.845 | 0.723 | 0.750 | 0.846 | 0.693 | 0.651 | 0.536 |
| 2002 | 0.583 | 0.586 | 0.663 | 0.694 | 0.693 | 0.679 | 0.707 | 0.753 | 0.854 | 0.834 | 0.769 | NA |
| 2003 | 0.909 | 0.982 | 1.029 | 0.844 | 0.732 | 0.729 | NA | 0.910 | 0.827 | 0.847 | 0.899 | 0.978 |
| 2004 | 1.019 | 1.049 | 1.096 | 1.206 | 1.289 | 1.136 | 1.203 | 1.297 | NA | NA | 1.514 | 1.343 |
| 2005 | 1.257 | 1.363 | 1.641 | 1.774 | 1.643 | 1.664 | 1.721 | 1.894 | 2.021 | 2.058 | 1.826 | 1.701 |
| 2006 | 1.845 | 1.866 | 1.835 | 2.009 | 2.180 | 2.182 | 2.221 | 2.252 | 2.071 | 1.867 | 1.836 | 2.007 |
| 2007 | 1.809 | 1.821 | 1.876 | 2.004 | 2.099 | 2.123 | 2.180 | 2.164 | 2.235 | 2.378 | 2.692 | 2.690 |
| 2008 | 2.640 | 2.693 | 3.083 | 3.296 | 3.668 | 3.946 | 4.005 | 3.512 | 3.142 | 2.589 | 1.955 | 1.557 |
| 2009 | 1.414 | 1.365 | 1.326 | 1.469 | 1.475 | 1.796 | 1.768 | 1.908 | 1.845 | 1.920 | 2.086 | 2.016 |
| 2010 | 2.118 | 1.999 | 2.117 | 2.250 | 2.206 | 2.102 | 2.137 | 2.152 | 2.130 | 2.307 | 2.385 | 2.485 |
| 2011 | 2.591 | 2.759 | 3.126 | 3.322 | 3.245 | 3.136 | 3.082 | 2.983 | 3.046 | 2.991 | 3.115 | 2.973 |
| 2012 | 3.046 | 3.166 | 3.377 | 3.298 | 3.101 | 2.764 | 2.782 | 3.042 | 3.308 | 3.204 | 3.050 | 2.973 |
| 2013 | 3.061 | 3.296 | 3.081 | 2.936 | 2.762 | 2.779 | 2.876 | 2.954 | 3.019 | 2.905 | 2.861 | 3.002 |
| 2014 | 2.941 | 2.933 | 2.847 | 2.894 | 3.035 | 2.969 | 2.905 | 2.912 | 2.835 | 2.528 | 2.414 | 2.034 |
| 2015 | 1.636 | 1.666 | 1.782 | 1.719 | 2.111 | 1.924 | 1.730 | 1.527 | 1.472 | 1.471 | 1.404 | 1.242 |
| 2016 | 1.060 | 1.028 | 1.130 | 1.209 | 1.349 | 1.472 | 1.404 | 1.297 | 1.355 | 1.482 | 1.430 | 1.533 |
| 2017 | 1.551 | 1.609 | 1.574 | 1.580 | 1.471 | 1.419 | 1.493 | 1.613 | 1.746 | 1.744 | 1.846 | 1.829 |
| 2018 | 1.997 | 1.972 | 1.949 | 2.099 | 2.222 | 2.207 | 2.163 | 2.153 | 2.235 | 2.342 | 2.200 | 1.875 |
| 2019 | 1.830 | 1.952 | 2.004 | 2.101 | 2.240 | 1.905 | 1.941 | 1.866 | 1.925 | 1.978 | 2.112 | 2.018 |
| 2020 | 2.002 | 1.700 | 1.336 | 0.686 | 0.656 | 1.048 | 1.177 | 1.170 | 1.065 | 1.126 | 1.261 | 1.436 |
| 2021 | 1.509 | 1.581 | 1.743 | 1.692 | 1.805 | 1.825 | 1.950 | 2.064 | 2.021 | 2.248 | 2.250 | 2.167 |
| 2022 | 2.461 | 2.537 | 3.261 | |||||||||
| - = No Data Reported; -- = Not Applicable; NA = Not Available; W = Withheld to avoid disclosure of individual company data. |
| Release Date: 6/1/2022 |
| Next Release Date: TBD |