|
Download Data (XLS File) |
|
||||||||
|
||||||||
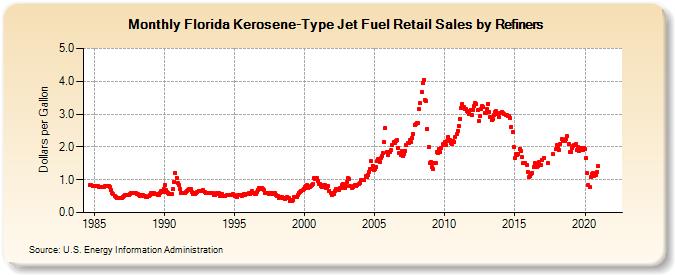
| Florida Kerosene-Type Jet Fuel Retail Sales by Refiners (Dollars per Gallon) | ||||||||
| Year | Jan | Feb | Mar | Apr | May | Jun | Jul | Aug | Sep | Oct | Nov | Dec |
|---|---|---|---|---|---|---|---|---|---|---|---|---|
| 1984 | 0.827 | 0.841 | 0.820 | 0.815 | ||||||||
| 1985 | 0.810 | 0.804 | 0.800 | 0.796 | 0.793 | 0.781 | 0.774 | 0.780 | 0.782 | 0.796 | 0.812 | 0.820 |
| 1986 | 0.806 | 0.784 | 0.686 | 0.590 | 0.553 | 0.512 | 0.467 | 0.439 | 0.448 | 0.442 | 0.440 | 0.443 |
| 1987 | 0.477 | 0.513 | 0.520 | 0.527 | 0.535 | 0.550 | 0.566 | 0.587 | 0.585 | 0.593 | 0.599 | 0.581 |
| 1988 | 0.566 | 0.555 | 0.533 | 0.517 | 0.526 | 0.523 | 0.493 | 0.491 | 0.485 | 0.473 | 0.491 | 0.535 |
| 1989 | 0.590 | 0.584 | 0.577 | 0.592 | 0.566 | 0.554 | 0.549 | 0.550 | 0.594 | 0.645 | 0.638 | 0.716 |
| 1990 | 0.846 | 0.692 | 0.630 | 0.606 | 0.580 | 0.557 | 0.560 | 0.724 | 0.942 | 1.217 | 1.067 | 0.893 |
| 1991 | 0.826 | 0.722 | 0.609 | 0.592 | 0.604 | 0.606 | 0.617 | 0.653 | 0.682 | 0.704 | 0.719 | 0.619 |
| 1992 | 0.551 | 0.593 | 0.569 | 0.583 | 0.620 | 0.660 | 0.658 | 0.650 | 0.661 | 0.680 | 0.624 | 0.586 |
| 1993 | 0.583 | 0.591 | 0.603 | 0.594 | 0.597 | 0.585 | 0.550 | 0.533 | 0.557 | 0.605 | 0.585 | 0.501 |
| 1994 | 0.533 | 0.567 | 0.496 | 0.500 | 0.508 | 0.522 | 0.542 | 0.542 | 0.529 | 0.538 | 0.559 | 0.526 |
| 1995 | 0.516 | 0.507 | 0.487 | 0.523 | 0.548 | 0.525 | 0.502 | 0.525 | 0.551 | 0.536 | 0.556 | 0.576 |
| 1996 | 0.606 | 0.564 | 0.595 | 0.645 | 0.599 | 0.558 | 0.576 | 0.620 | 0.693 | 0.740 | 0.721 | 0.743 |
| 1997 | 0.717 | 0.685 | 0.604 | 0.588 | 0.583 | 0.571 | 0.567 | 0.599 | 0.577 | 0.610 | 0.600 | 0.545 |
| 1998 | 0.511 | 0.506 | 0.454 | 0.460 | 0.468 | 0.434 | 0.443 | 0.416 | 0.444 | 0.469 | 0.436 | 0.358 |
| 1999 | 0.371 | 0.355 | 0.385 | 0.461 | 0.462 | 0.466 | 0.533 | 0.585 | 0.633 | 0.649 | 0.678 | 0.730 |
| 2000 | 0.790 | 0.815 | 0.826 | 0.761 | 0.782 | 0.804 | 0.846 | 0.873 | 1.055 | 1.017 | 1.044 | 0.969 |
| 2001 | 0.880 | 0.869 | 0.795 | 0.793 | 0.844 | 0.829 | 0.761 | 0.784 | 0.813 | 0.666 | 0.605 | 0.548 |
| 2002 | 0.585 | 0.577 | 0.650 | 0.705 | 0.727 | 0.695 | 0.737 | 0.747 | 0.831 | 0.855 | 0.762 | 0.814 |
| 2003 | 0.918 | 1.038 | 1.026 | 0.800 | 0.757 | 0.773 | 0.816 | 0.850 | 0.804 | 0.844 | 0.868 | 0.901 |
| 2004 | 0.996 | 0.988 | 0.991 | 0.994 | 1.109 | 1.083 | 1.149 | 1.248 | 1.329 | 1.559 | 1.424 | 1.307 |
| 2005 | 1.327 | 1.373 | 1.562 | 1.633 | 1.540 | 1.655 | 1.712 | 1.818 | 2.152 | 2.576 | 1.837 | 1.747 |
| 2006 | 1.852 | 1.846 | 1.891 | 2.062 | 2.155 | 2.115 | 2.182 | 2.210 | 1.978 | 1.828 | 1.768 | 1.886 |
| 2007 | 1.728 | 1.784 | 1.876 | 2.069 | 2.110 | 2.133 | 2.195 | 2.162 | 2.275 | 2.404 | 2.679 | 2.693 |
| 2008 | 2.717 | 2.714 | 3.139 | 3.330 | 3.671 | 3.931 | 4.043 | 3.443 | 3.400 | 2.555 | 2.005 | 1.512 |
| 2009 | 1.540 | 1.388 | 1.316 | 1.503 | 1.511 | 1.851 | 1.803 | 1.939 | 1.850 | 1.961 | 2.080 | 2.045 |
| 2010 | 2.155 | 2.043 | 2.178 | 2.300 | 2.218 | 2.120 | 2.101 | 2.172 | 2.158 | 2.303 | 2.380 | 2.493 |
| 2011 | 2.648 | 2.864 | 3.179 | 3.312 | 3.222 | 3.155 | 3.151 | 3.100 | 3.073 | 3.010 | 3.137 | 2.965 |
| 2012 | 3.128 | 3.245 | 3.345 | 3.310 | 3.109 | 2.789 | 2.935 | 3.168 | 3.251 | 3.209 | 3.035 | 3.038 |
| 2013 | 3.169 | 3.312 | 3.073 | 2.912 | 2.811 | 2.843 | 2.957 | 3.070 | 3.082 | 2.991 | 2.920 | 3.047 |
| 2014 | 3.042 | 3.065 | 3.029 | 2.994 | 2.980 | 2.974 | 2.951 | 2.944 | 2.877 | 2.621 | 2.451 | 1.996 |
| 2015 | 1.659 | 1.798 | 1.768 | 1.783 | 1.945 | 1.860 | 1.688 | 1.521 | 1.502 | 1.506 | 1.460 | 1.236 |
| 2016 | 1.073 | 1.099 | 1.176 | 1.215 | 1.393 | 1.505 | 1.404 | 1.385 | 1.427 | 1.549 | 1.442 | 1.595 |
| 2017 | W | 1.666 | W | W | 1.512 | W | W | W | NA | 1.772 | W | 1.925 |
| 2018 | 2.056 | 1.961 | 1.910 | 2.073 | 2.239 | 2.173 | 2.182 | 2.178 | 2.240 | 2.324 | 2.099 | 1.840 |
| 2019 | 1.852 | 1.952 | 2.014 | 2.044 | 2.075 | 1.918 | 1.983 | 1.886 | 1.936 | 1.968 | 1.901 | 1.965 |
| 2020 | 1.929 | 1.647 | 1.204 | 0.832 | 0.778 | 1.082 | 1.170 | 1.209 | 1.123 | 1.158 | 1.226 | 1.412 |
| 2021 | W | W | W | W | W | W | W | W | W | W | W | W |
| 2022 | W | W | W | |||||||||
| - = No Data Reported; -- = Not Applicable; NA = Not Available; W = Withheld to avoid disclosure of individual company data. |
| Release Date: 6/1/2022 |
| Next Release Date: TBD |