|
Download Data (XLS File) |
|
||||||||
|
||||||||
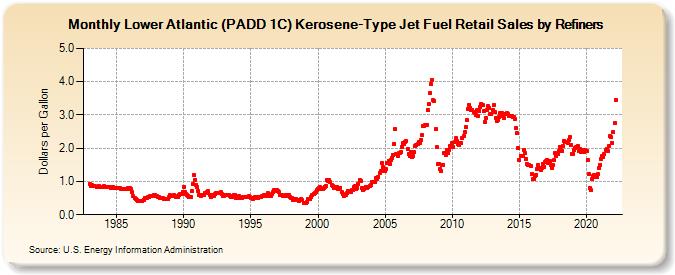
| Lower Atlantic (PADD 1C) Kerosene-Type Jet Fuel Retail Sales by Refiners (Dollars per Gallon) | ||||||||
| Year | Jan | Feb | Mar | Apr | May | Jun | Jul | Aug | Sep | Oct | Nov | Dec |
|---|---|---|---|---|---|---|---|---|---|---|---|---|
| 1983 | 0.925 | 0.873 | 0.891 | 0.877 | 0.866 | 0.850 | 0.843 | 0.842 | 0.850 | 0.848 | 0.844 | 0.843 |
| 1984 | 0.845 | 0.854 | 0.847 | 0.841 | 0.833 | 0.832 | 0.827 | 0.817 | 0.817 | 0.823 | 0.809 | 0.806 |
| 1985 | 0.800 | 0.796 | 0.791 | 0.789 | 0.784 | 0.773 | 0.763 | 0.763 | 0.765 | 0.778 | 0.789 | 0.796 |
| 1986 | 0.789 | 0.770 | 0.670 | 0.552 | 0.505 | 0.471 | 0.435 | 0.410 | 0.418 | 0.399 | 0.414 | 0.418 |
| 1987 | 0.454 | 0.489 | 0.497 | 0.507 | 0.520 | 0.533 | 0.552 | 0.574 | 0.574 | 0.580 | 0.586 | 0.567 |
| 1988 | 0.552 | 0.542 | 0.522 | 0.502 | 0.514 | 0.510 | 0.480 | 0.481 | 0.472 | 0.458 | 0.479 | 0.519 |
| 1989 | 0.578 | 0.569 | 0.567 | 0.584 | 0.555 | 0.538 | 0.537 | 0.540 | 0.579 | 0.627 | 0.622 | 0.690 |
| 1990 | 0.838 | 0.682 | 0.618 | 0.593 | 0.566 | 0.545 | 0.546 | 0.712 | 0.917 | 1.189 | 1.058 | 0.895 |
| 1991 | 0.825 | 0.709 | 0.597 | 0.573 | 0.584 | 0.587 | 0.600 | 0.638 | 0.667 | 0.689 | 0.705 | 0.606 |
| 1992 | 0.541 | 0.581 | 0.559 | 0.572 | 0.610 | 0.647 | 0.650 | 0.639 | 0.651 | 0.668 | 0.619 | 0.577 |
| 1993 | 0.576 | 0.583 | 0.598 | 0.587 | 0.590 | 0.577 | 0.540 | 0.528 | 0.554 | 0.599 | 0.578 | 0.498 |
| 1994 | 0.526 | 0.557 | 0.491 | 0.494 | 0.501 | 0.518 | 0.537 | 0.538 | 0.522 | 0.534 | 0.551 | 0.523 |
| 1995 | 0.512 | 0.501 | 0.483 | 0.516 | 0.541 | 0.522 | 0.497 | 0.518 | 0.543 | 0.531 | 0.550 | 0.571 |
| 1996 | 0.599 | 0.559 | 0.588 | 0.640 | 0.593 | 0.553 | 0.574 | 0.619 | 0.690 | 0.736 | 0.718 | 0.739 |
| 1997 | 0.711 | 0.682 | 0.599 | 0.584 | 0.579 | 0.565 | 0.565 | 0.594 | 0.573 | 0.606 | 0.595 | 0.542 |
| 1998 | 0.511 | 0.501 | 0.453 | 0.459 | 0.463 | 0.430 | 0.437 | 0.413 | 0.438 | 0.465 | 0.430 | 0.355 |
| 1999 | 0.367 | 0.352 | 0.383 | 0.459 | 0.458 | 0.462 | 0.529 | 0.583 | 0.632 | 0.643 | 0.673 | 0.728 |
| 2000 | 0.787 | 0.807 | 0.823 | 0.760 | 0.781 | 0.802 | 0.843 | 0.873 | 1.054 | 1.016 | 1.041 | 0.975 |
| 2001 | 0.880 | 0.868 | 0.795 | 0.791 | 0.841 | 0.832 | 0.761 | 0.781 | 0.815 | 0.668 | 0.615 | 0.549 |
| 2002 | 0.580 | 0.585 | 0.643 | 0.702 | 0.720 | 0.689 | 0.729 | 0.741 | 0.821 | 0.850 | 0.758 | 0.806 |
| 2003 | 0.916 | 1.034 | 1.027 | 0.796 | 0.757 | 0.773 | 0.810 | 0.845 | 0.797 | 0.841 | 0.862 | 0.897 |
| 2004 | 0.989 | 0.984 | 0.989 | 0.993 | 1.109 | 1.073 | 1.146 | 1.248 | 1.318 | 1.549 | 1.424 | 1.303 |
| 2005 | 1.323 | 1.362 | 1.553 | 1.626 | 1.526 | 1.640 | 1.718 | 1.807 | 2.138 | 2.575 | 1.836 | 1.761 |
| 2006 | 1.845 | 1.843 | 1.890 | 2.050 | 2.147 | 2.131 | 2.172 | 2.207 | 1.969 | 1.829 | 1.777 | 1.881 |
| 2007 | 1.724 | 1.777 | 1.872 | 2.061 | 2.109 | 2.125 | 2.176 | 2.154 | 2.261 | 2.384 | 2.674 | 2.675 |
| 2008 | 2.704 | 2.704 | 3.135 | 3.323 | 3.655 | 3.928 | 4.035 | 3.441 | 3.420 | 2.581 | 2.023 | 1.520 |
| 2009 | 1.535 | 1.382 | 1.308 | 1.494 | 1.504 | 1.846 | 1.804 | 1.939 | 1.852 | 1.952 | 2.075 | 2.038 |
| 2010 | 2.149 | 2.040 | 2.174 | 2.292 | 2.213 | 2.113 | 2.097 | 2.162 | 2.152 | 2.293 | 2.373 | 2.485 |
| 2011 | 2.630 | 2.853 | 3.169 | 3.305 | 3.217 | 3.154 | 3.151 | 3.100 | 3.071 | 3.004 | 3.133 | 2.964 |
| 2012 | 3.121 | 3.237 | 3.343 | 3.306 | 3.116 | 2.788 | 2.921 | 3.158 | 3.256 | 3.208 | 3.030 | 3.031 |
| 2013 | 3.151 | 3.299 | 3.074 | 2.911 | 2.806 | 2.836 | 2.942 | 3.056 | 3.072 | 2.974 | 2.908 | 3.034 |
| 2014 | 3.030 | 3.052 | 3.021 | 2.980 | 2.968 | 2.964 | 2.940 | 2.934 | 2.867 | 2.611 | 2.446 | 1.999 |
| 2015 | 1.640 | 1.780 | 1.759 | 1.770 | 1.938 | 1.853 | 1.688 | 1.518 | 1.493 | 1.494 | 1.452 | 1.234 |
| 2016 | 1.062 | 1.085 | 1.162 | 1.204 | 1.376 | 1.491 | 1.396 | 1.357 | 1.415 | 1.529 | 1.434 | 1.571 |
| 2017 | 1.618 | 1.652 | 1.552 | 1.600 | 1.496 | 1.406 | 1.489 | 1.644 | 1.849 | 1.755 | 1.838 | 1.906 |
| 2018 | 2.044 | 1.959 | 1.907 | 2.065 | 2.228 | 2.176 | 2.172 | 2.170 | 2.238 | 2.323 | 2.110 | 1.835 |
| 2019 | 1.834 | 1.942 | 2.000 | 2.034 | 2.071 | 1.910 | 1.981 | 1.893 | 1.929 | 1.955 | 1.896 | 1.950 |
| 2020 | 1.930 | 1.643 | 1.236 | 0.797 | 0.730 | 1.076 | 1.163 | 1.196 | 1.124 | 1.142 | 1.211 | 1.402 |
| 2021 | 1.500 | 1.672 | 1.760 | 1.739 | 1.828 | 1.938 | 1.982 | 1.916 | 2.061 | 2.357 | 2.324 | 2.166 |
| 2022 | 2.478 | 2.748 | 3.446 | |||||||||
| - = No Data Reported; -- = Not Applicable; NA = Not Available; W = Withheld to avoid disclosure of individual company data. |
| Release Date: 6/1/2022 |
| Next Release Date: TBD |