|
Download Data (XLS File) |
|
||||||||
|
||||||||
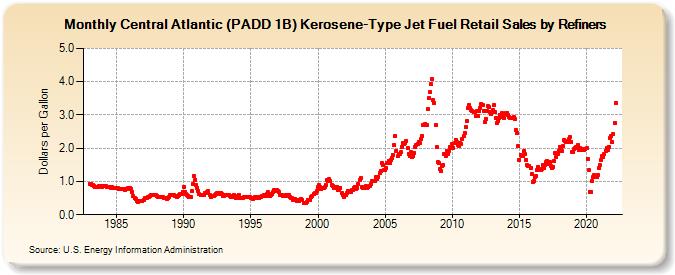
| Central Atlantic (PADD 1B) Kerosene-Type Jet Fuel Retail Sales by Refiners (Dollars per Gallon) | ||||||||
| Year | Jan | Feb | Mar | Apr | May | Jun | Jul | Aug | Sep | Oct | Nov | Dec |
|---|---|---|---|---|---|---|---|---|---|---|---|---|
| 1983 | 0.932 | 0.925 | 0.890 | 0.883 | 0.867 | 0.841 | 0.845 | 0.841 | 0.852 | 0.855 | 0.853 | 0.848 |
| 1984 | 0.878 | 0.868 | 0.850 | 0.844 | 0.844 | 0.836 | 0.823 | 0.818 | 0.819 | 0.817 | 0.807 | 0.800 |
| 1985 | 0.804 | 0.790 | 0.783 | 0.778 | 0.771 | 0.760 | 0.777 | 0.757 | 0.766 | 0.784 | 0.795 | 0.809 |
| 1986 | 0.807 | 0.779 | 0.686 | 0.552 | 0.492 | 0.476 | 0.427 | 0.395 | 0.405 | 0.406 | 0.415 | 0.419 |
| 1987 | 0.454 | 0.491 | 0.502 | 0.511 | 0.525 | 0.543 | 0.561 | 0.586 | 0.580 | 0.594 | 0.602 | 0.582 |
| 1988 | 0.567 | 0.547 | 0.534 | 0.521 | 0.532 | 0.525 | 0.496 | 0.491 | 0.494 | 0.472 | 0.494 | 0.529 |
| 1989 | 0.579 | 0.593 | 0.591 | 0.590 | 0.565 | 0.552 | 0.542 | 0.553 | 0.587 | 0.633 | 0.636 | 0.684 |
| 1990 | 0.831 | 0.696 | 0.619 | 0.592 | 0.569 | 0.543 | 0.544 | 0.706 | 0.909 | 1.168 | 1.050 | 0.894 |
| 1991 | 0.808 | 0.714 | 0.613 | 0.585 | 0.594 | 0.591 | 0.604 | 0.638 | 0.666 | 0.689 | 0.702 | 0.599 |
| 1992 | 0.537 | 0.575 | 0.553 | 0.566 | 0.603 | 0.634 | 0.642 | 0.629 | 0.641 | 0.658 | 0.609 | 0.571 |
| 1993 | 0.570 | 0.578 | 0.601 | 0.581 | 0.584 | 0.564 | 0.533 | 0.522 | 0.549 | 0.596 | 0.577 | 0.501 |
| 1994 | 0.527 | 0.597 | 0.498 | 0.497 | 0.503 | 0.512 | 0.531 | 0.536 | 0.518 | 0.527 | 0.546 | 0.524 |
| 1995 | 0.512 | 0.497 | 0.479 | 0.511 | 0.537 | 0.524 | 0.498 | 0.516 | 0.543 | 0.533 | 0.549 | 0.575 |
| 1996 | 0.603 | 0.573 | 0.610 | 0.682 | 0.608 | 0.554 | 0.583 | 0.618 | 0.694 | 0.739 | 0.726 | 0.744 |
| 1997 | 0.721 | 0.690 | 0.601 | 0.587 | 0.579 | 0.565 | 0.562 | 0.588 | 0.573 | 0.600 | 0.588 | 0.545 |
| 1998 | 0.512 | 0.494 | 0.455 | 0.459 | 0.453 | 0.427 | 0.430 | 0.414 | 0.435 | 0.459 | 0.439 | 0.362 |
| 1999 | 0.357 | 0.343 | 0.390 | 0.457 | 0.457 | 0.455 | 0.523 | 0.573 | 0.618 | 0.639 | 0.651 | 0.717 |
| 2000 | 0.821 | 0.885 | 0.819 | 0.772 | 0.791 | 0.792 | 0.839 | 0.880 | 1.049 | 1.023 | 1.066 | 1.002 |
| 2001 | 0.889 | 0.871 | 0.795 | 0.805 | 0.844 | 0.823 | 0.744 | 0.774 | 0.806 | 0.660 | 0.603 | 0.543 |
| 2002 | 0.584 | 0.585 | 0.640 | 0.698 | 0.714 | 0.693 | 0.733 | 0.745 | 0.811 | 0.846 | 0.773 | 0.808 |
| 2003 | 0.918 | 1.052 | 1.089 | 0.837 | 0.792 | 0.789 | 0.823 | 0.856 | 0.812 | 0.847 | 0.870 | 0.914 |
| 2004 | 1.000 | 1.028 | 1.007 | 1.004 | 1.138 | 1.088 | 1.146 | 1.254 | 1.325 | 1.541 | 1.481 | 1.359 |
| 2005 | 1.337 | 1.392 | 1.541 | 1.629 | 1.546 | 1.637 | 1.716 | 1.799 | 2.087 | 2.366 | 1.926 | 1.759 |
| 2006 | 1.826 | 1.833 | 1.874 | 2.046 | 2.149 | 2.128 | 2.159 | 2.222 | 1.999 | 1.832 | 1.775 | 1.885 |
| 2007 | 1.741 | 1.764 | 1.861 | 2.025 | 2.104 | 2.134 | 2.187 | 2.155 | 2.283 | 2.379 | 2.684 | 2.697 |
| 2008 | 2.738 | 2.702 | 3.168 | 3.500 | 3.677 | 3.926 | 4.066 | 3.447 | 3.372 | 2.688 | 2.031 | 1.573 |
| 2009 | 1.541 | 1.383 | 1.302 | 1.464 | 1.490 | 1.817 | 1.765 | 1.928 | 1.821 | 1.923 | 2.048 | 2.010 |
| 2010 | 2.134 | 2.019 | 2.148 | 2.260 | 2.182 | 2.093 | 2.075 | 2.144 | 2.136 | 2.273 | 2.353 | 2.462 |
| 2011 | 2.631 | 2.823 | 3.207 | 3.294 | 3.219 | 3.136 | 3.109 | 3.085 | 3.073 | 2.971 | 3.126 | 2.965 |
| 2012 | 3.111 | 3.221 | 3.323 | 3.286 | 3.132 | 2.782 | 2.870 | 3.118 | 3.267 | 3.229 | 3.087 | 3.038 |
| 2013 | 3.149 | 3.289 | 3.077 | 2.899 | 2.763 | 2.816 | 2.904 | 3.011 | 3.043 | 2.929 | 2.901 | 3.036 |
| 2014 | 3.061 | 3.069 | 3.007 | 2.941 | 2.916 | 2.920 | 2.896 | 2.924 | 2.865 | 2.552 | 2.466 | 2.051 |
| 2015 | 1.651 | 1.798 | 1.763 | 1.756 | 1.904 | 1.815 | 1.658 | 1.487 | 1.468 | 1.466 | 1.419 | 1.222 |
| 2016 | 0.996 | 1.027 | 1.134 | 1.161 | 1.332 | 1.430 | 1.344 | 1.330 | 1.389 | 1.480 | 1.396 | 1.504 |
| 2017 | 1.580 | 1.605 | 1.526 | 1.578 | 1.470 | 1.412 | 1.442 | 1.622 | 1.866 | 1.747 | 1.835 | 1.927 |
| 2018 | 2.049 | 1.979 | 1.908 | 2.079 | 2.240 | 2.204 | 2.173 | 2.194 | 2.262 | 2.326 | 2.197 | 1.895 |
| 2019 | 1.887 | 1.979 | 2.005 | 2.032 | 2.091 | 1.946 | 2.008 | 1.931 | 1.935 | 1.988 | 1.947 | 1.976 |
| 2020 | 1.994 | 1.681 | 1.333 | 0.696 | 0.686 | 1.012 | 1.146 | 1.188 | 1.132 | 1.141 | 1.188 | 1.394 |
| 2021 | 1.491 | 1.634 | 1.770 | 1.728 | 1.837 | 1.919 | 2.009 | 1.948 | 2.044 | 2.310 | 2.366 | 2.182 |
| 2022 | 2.421 | 2.768 | 3.356 | |||||||||
| - = No Data Reported; -- = Not Applicable; NA = Not Available; W = Withheld to avoid disclosure of individual company data. |
| Release Date: 6/1/2022 |
| Next Release Date: TBD |