|
Download Data (XLS File) |
|
||||||||
|
||||||||
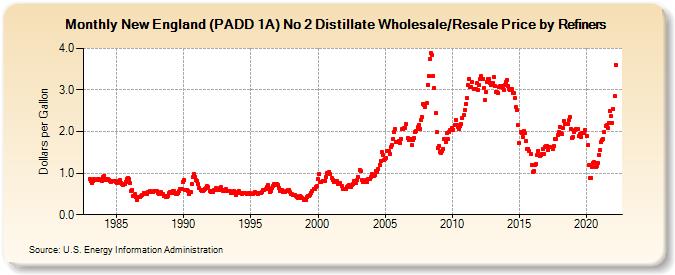
| New England (PADD 1A) No 2 Distillate Wholesale/Resale Price by Refiners (Dollars per Gallon) | ||||||||
| Year | Jan | Feb | Mar | Apr | May | Jun | Jul | Aug | Sep | Oct | Nov | Dec |
|---|---|---|---|---|---|---|---|---|---|---|---|---|
| 1983 | 0.853 | 0.813 | 0.765 | 0.809 | 0.847 | 0.829 | 0.842 | 0.857 | 0.867 | 0.841 | 0.836 | 0.817 |
| 1984 | 0.907 | 0.939 | 0.825 | 0.866 | 0.858 | 0.837 | 0.799 | 0.788 | 0.810 | 0.819 | 0.799 | 0.780 |
| 1985 | 0.774 | 0.787 | 0.812 | 0.830 | 0.772 | 0.738 | 0.718 | 0.747 | 0.796 | 0.848 | 0.893 | 0.860 |
| 1986 | 0.753 | 0.569 | 0.591 | 0.460 | 0.491 | 0.419 | 0.364 | 0.418 | 0.429 | 0.428 | 0.442 | 0.473 |
| 1987 | 0.530 | 0.513 | 0.496 | 0.509 | 0.550 | 0.540 | 0.566 | 0.550 | 0.536 | 0.561 | 0.576 | 0.580 |
| 1988 | 0.563 | 0.521 | 0.503 | 0.534 | 0.538 | 0.489 | 0.448 | 0.458 | 0.437 | 0.423 | 0.461 | 0.532 |
| 1989 | 0.549 | 0.528 | 0.582 | 0.564 | 0.530 | 0.510 | 0.500 | 0.520 | 0.570 | 0.613 | 0.608 | 0.790 |
| 1990 | 0.824 | 0.598 | 0.603 | 0.602 | 0.565 | 0.509 | 0.544 | 0.749 | 0.895 | 0.982 | 0.915 | 0.832 |
| 1991 | 0.809 | 0.735 | 0.652 | 0.591 | 0.582 | 0.564 | 0.595 | 0.626 | 0.639 | 0.683 | 0.672 | 0.575 |
| 1992 | 0.536 | 0.560 | 0.544 | 0.584 | 0.594 | 0.634 | 0.622 | 0.602 | 0.639 | 0.655 | 0.597 | 0.575 |
| 1993 | 0.562 | 0.587 | 0.608 | 0.581 | 0.572 | 0.561 | 0.524 | 0.529 | 0.545 | 0.572 | 0.539 | 0.472 |
| 1994 | 0.529 | 0.579 | 0.525 | 0.511 | 0.508 | 0.515 | 0.524 | 0.523 | 0.502 | 0.508 | 0.518 | 0.513 |
| 1995 | 0.509 | 0.502 | 0.488 | 0.518 | 0.537 | 0.512 | 0.495 | 0.517 | 0.524 | 0.516 | 0.541 | 0.591 |
| 1996 | 0.586 | 0.615 | 0.660 | 0.713 | 0.624 | 0.547 | 0.581 | 0.633 | 0.695 | 0.749 | 0.725 | 0.738 |
| 1997 | 0.721 | 0.654 | 0.580 | 0.597 | 0.595 | 0.551 | 0.558 | 0.574 | 0.560 | 0.600 | 0.594 | 0.548 |
| 1998 | 0.509 | 0.489 | 0.468 | 0.471 | 0.456 | 0.428 | 0.412 | 0.390 | 0.445 | 0.433 | 0.403 | 0.356 |
| 1999 | 0.369 | 0.345 | 0.416 | 0.460 | 0.449 | 0.467 | 0.513 | 0.573 | 0.625 | 0.617 | 0.667 | 0.681 |
| 2000 | 0.869 | 0.971 | 0.792 | 0.780 | 0.812 | 0.806 | 0.819 | 0.909 | 1.006 | 1.011 | 1.037 | 0.978 |
| 2001 | 0.890 | 0.826 | 0.777 | 0.813 | 0.807 | 0.802 | 0.734 | 0.764 | 0.763 | 0.683 | 0.621 | 0.608 |
| 2002 | 0.611 | 0.607 | 0.658 | 0.695 | 0.703 | 0.676 | 0.717 | 0.728 | 0.806 | 0.793 | 0.753 | 0.824 |
| 2003 | 0.902 | 1.080 | 1.041 | 0.833 | 0.790 | 0.787 | 0.816 | 0.846 | 0.776 | 0.847 | 0.852 | 0.904 |
| 2004 | 0.972 | 0.934 | 0.920 | 0.944 | 1.041 | 1.032 | 1.102 | 1.199 | 1.287 | 1.504 | 1.425 | 1.315 |
| 2005 | 1.337 | 1.361 | 1.522 | 1.541 | 1.462 | 1.631 | 1.668 | 1.824 | 1.995 | 2.050 | 1.741 | 1.747 |
| 2006 | 1.778 | 1.720 | 1.827 | 2.052 | 2.063 | 2.078 | 2.095 | 2.176 | 1.842 | 1.794 | 1.789 | 1.818 |
| 2007 | 1.679 | 1.805 | 1.852 | 1.982 | 2.022 | 2.098 | 2.152 | 2.073 | 2.274 | 2.338 | 2.670 | 2.638 |
| 2008 | 2.597 | 2.678 | 3.127 | 3.335 | 3.746 | 3.881 | 3.834 | 3.332 | 3.043 | 2.452 | 1.983 | 1.609 |
| 2009 | 1.649 | 1.519 | 1.479 | 1.528 | 1.587 | 1.824 | 1.742 | 1.956 | 1.821 | 1.997 | 2.031 | 2.030 |
| 2010 | 2.097 | 2.048 | 2.157 | 2.283 | 2.154 | 2.110 | 2.073 | 2.123 | 2.175 | 2.324 | 2.388 | 2.530 |
| 2011 | 2.670 | 2.807 | 3.117 | 3.264 | 3.073 | 3.067 | 3.183 | 3.027 | 3.012 | 3.031 | 3.156 | 3.010 |
| 2012 | 3.117 | 3.274 | 3.332 | 3.272 | 3.051 | 2.752 | 2.948 | 3.196 | 3.269 | 3.273 | 3.179 | 3.123 |
| 2013 | 3.178 | 3.316 | 3.087 | 2.954 | 2.944 | 2.936 | 3.064 | 3.090 | 3.105 | 3.049 | 3.006 | 3.129 |
| 2014 | 3.187 | 3.239 | 3.096 | 3.027 | 3.004 | 3.022 | 2.939 | 2.919 | 2.812 | 2.584 | 2.510 | 2.153 |
| 2015 | 1.729 | 1.989 | 1.957 | 1.874 | 2.011 | 1.959 | 1.771 | 1.570 | 1.588 | 1.522 | 1.457 | 1.190 |
| 2016 | 1.035 | 1.059 | 1.188 | 1.222 | 1.442 | 1.535 | 1.417 | 1.430 | 1.449 | 1.579 | 1.465 | 1.635 |
| 2017 | 1.643 | 1.654 | 1.557 | 1.640 | NA | NA | 1.581 | 1.652 | 1.829 | 1.824 | 1.908 | 1.982 |
| 2018 | 2.116 | 1.959 | 1.946 | 2.095 | 2.259 | 2.190 | 2.179 | 2.179 | 2.270 | 2.353 | 2.070 | 1.846 |
| 2019 | 1.879 | 1.984 | 2.027 | 2.062 | 2.059 | 1.891 | 1.949 | 1.876 | 1.968 | 1.977 | 1.963 | 2.027 |
| 2020 | 1.890 | 1.667 | 1.201 | 0.890 | 0.885 | 1.150 | 1.248 | 1.266 | 1.150 | 1.181 | 1.252 | 1.448 |
| 2021 | 1.553 | 1.738 | 1.804 | 1.826 | 2.001 | 2.134 | 2.149 | 2.084 | 2.201 | 2.494 | 2.371 | 2.214 |
| 2022 | 2.546 | 2.852 | 3.611 | |||||||||
| - = No Data Reported; -- = Not Applicable; NA = Not Available; W = Withheld to avoid disclosure of individual company data. |
| Release Date: 6/1/2022 |
| Next Release Date: TBD |