|
Download Data (XLS File) |
|
||||||||
|
||||||||
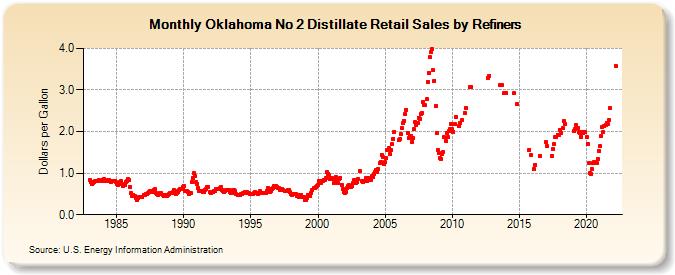
| Oklahoma No 2 Distillate Retail Sales by Refiners (Dollars per Gallon) | ||||||||
| Year | Jan | Feb | Mar | Apr | May | Jun | Jul | Aug | Sep | Oct | Nov | Dec |
|---|---|---|---|---|---|---|---|---|---|---|---|---|
| 1983 | 0.846 | 0.783 | 0.735 | 0.759 | 0.790 | 0.802 | 0.813 | 0.821 | 0.843 | 0.842 | 0.825 | 0.804 |
| 1984 | 0.833 | 0.847 | 0.805 | 0.805 | 0.823 | 0.831 | 0.809 | 0.796 | 0.803 | 0.819 | 0.806 | 0.781 |
| 1985 | 0.741 | 0.709 | 0.728 | 0.784 | 0.799 | 0.747 | 0.699 | 0.726 | 0.787 | 0.821 | 0.866 | 0.827 |
| 1986 | 0.669 | 0.515 | 0.462 | 0.477 | 0.450 | 0.403 | 0.344 | 0.407 | 0.427 | 0.414 | 0.422 | 0.418 |
| 1987 | 0.483 | 0.482 | 0.502 | 0.498 | 0.521 | 0.539 | 0.564 | 0.568 | 0.545 | 0.591 | 0.610 | 0.533 |
| 1988 | 0.500 | 0.482 | 0.487 | 0.533 | 0.511 | 0.485 | 0.462 | 0.467 | 0.454 | 0.452 | 0.476 | 0.499 |
| 1989 | 0.519 | 0.520 | 0.545 | 0.594 | 0.559 | 0.509 | 0.526 | 0.539 | 0.590 | 0.617 | 0.627 | 0.671 |
| 1990 | 0.699 | 0.578 | 0.582 | 0.570 | 0.544 | 0.503 | 0.527 | 0.775 | 0.885 | 0.998 | 0.936 | 0.791 |
| 1991 | 0.737 | 0.645 | 0.578 | 0.573 | 0.559 | 0.536 | 0.557 | 0.605 | 0.623 | 0.667 | 0.668 | 0.544 |
| 1992 | 0.520 | 0.548 | 0.546 | 0.566 | 0.582 | 0.615 | 0.626 | 0.615 | 0.635 | 0.668 | 0.602 | 0.569 |
| 1993 | 0.548 | 0.579 | 0.599 | 0.594 | 0.590 | 0.558 | 0.528 | 0.534 | 0.585 | 0.602 | 0.566 | 0.490 |
| 1994 | 0.473 | 0.482 | 0.478 | 0.501 | 0.508 | 0.515 | 0.534 | 0.551 | 0.544 | 0.522 | 0.531 | 0.502 |
| 1995 | 0.495 | 0.490 | 0.496 | 0.527 | 0.548 | 0.521 | 0.508 | 0.531 | 0.564 | 0.526 | 0.528 | 0.525 |
| 1996 | 0.515 | 0.532 | 0.576 | 0.644 | 0.627 | 0.554 | 0.570 | 0.608 | 0.653 | 0.689 | 0.696 | 0.658 |
| 1997 | 0.641 | 0.642 | 0.594 | 0.606 | 0.613 | 0.587 | 0.571 | 0.581 | 0.573 | 0.597 | 0.590 | 0.541 |
| 1998 | 0.492 | 0.477 | 0.496 | 0.503 | 0.492 | 0.461 | 0.463 | 0.436 | 0.468 | 0.477 | 0.436 | 0.423 |
| 1999 | 0.352 | 0.347 | 0.394 | 0.465 | 0.464 | 0.460 | 0.525 | 0.584 | 0.634 | 0.647 | 0.655 | 0.688 |
| 2000 | 0.710 | 0.810 | 0.816 | 0.767 | 0.814 | 0.843 | 0.835 | 0.881 | 1.023 | 0.987 | 0.949 | 0.856 |
| 2001 | 0.880 | 0.859 | 0.760 | 0.815 | 0.907 | 0.851 | 0.753 | 0.847 | 0.883 | 0.721 | 0.615 | 0.545 |
| 2002 | 0.529 | 0.547 | 0.647 | 0.701 | 0.703 | 0.665 | 0.701 | 0.755 | 0.823 | 0.832 | 0.774 | 0.791 |
| 2003 | 0.855 | 1.057 | NA | 0.811 | 0.785 | 0.803 | 0.819 | 0.894 | 0.812 | 0.890 | 0.828 | 0.843 |
| 2004 | 0.921 | 0.917 | 0.978 | 1.029 | 1.072 | 1.039 | 1.094 | 1.235 | 1.272 | 1.444 | 1.388 | 1.231 |
| 2005 | 1.261 | 1.356 | 1.566 | 1.600 | 1.468 | 1.555 | 1.700 | 1.819 | 1.997 | W | W | W |
| 2006 | 1.796 | 1.832 | 1.934 | 2.096 | 2.198 | 2.264 | 2.411 | 2.526 | 1.974 | 1.852 | 1.896 | 1.886 |
| 2007 | 1.758 | 1.835 | 2.064 | 2.228 | 2.154 | 2.208 | 2.332 | 2.311 | 2.416 | 2.451 | 2.714 | 2.634 |
| 2008 | 2.630 | 2.774 | 3.201 | 3.412 | 3.783 | 3.906 | 3.976 | 3.469 | 3.223 | 2.614 | 1.976 | 1.555 |
| 2009 | 1.487 | 1.369 | 1.345 | 1.457 | 1.513 | 1.859 | 1.782 | 1.973 | 1.857 | 2.012 | 2.061 | 2.193 |
| 2010 | 2.052 | 1.999 | 2.175 | 2.359 | NA | NA | 2.127 | 2.210 | NA | 2.276 | W | 2.453 |
| 2011 | 2.578 | W | W | NA | 3.077 | 3.074 | W | W | W | W | W | W |
| 2012 | W | W | W | W | W | W | W | W | 3.294 | 3.344 | W | W |
| 2013 | W | W | W | W | W | W | W | 3.127 | 3.125 | W | 2.920 | W |
| 2014 | 2.926 | W | W | W | W | W | W | 2.919 | W | W | 2.661 | W |
| 2015 | W | W | W | W | W | W | W | W | W | 1.567 | 1.439 | W |
| 2016 | W | 1.097 | 1.206 | W | W | W | 1.421 | W | W | W | W | W |
| 2017 | 1.743 | 1.646 | W | W | W | 1.416 | 1.572 | 1.700 | 1.870 | 1.873 | 1.926 | 1.906 |
| 2018 | 2.044 | 1.977 | NA | 2.079 | 2.255 | 2.184 | W | W | W | W | W | W |
| 2019 | W | 2.012 | 2.073 | 2.149 | 2.096 | 1.983 | 1.955 | 1.875 | 1.990 | 1.958 | 1.984 | 1.983 |
| 2020 | 1.859 | 1.699 | 1.244 | 1.004 | 0.991 | 1.088 | 1.238 | 1.277 | 1.233 | 1.246 | 1.343 | 1.531 |
| 2021 | 1.644 | 1.903 | 2.108 | 1.979 | 2.125 | 2.162 | 2.216 | 2.171 | 2.268 | 2.559 | W | W |
| 2022 | W | W | 3.581 | |||||||||
| - = No Data Reported; -- = Not Applicable; NA = Not Available; W = Withheld to avoid disclosure of individual company data. |
| Release Date: 6/1/2022 |
| Next Release Date: TBD |