|
Download Data (XLS File) |
|
||||||||
|
||||||||
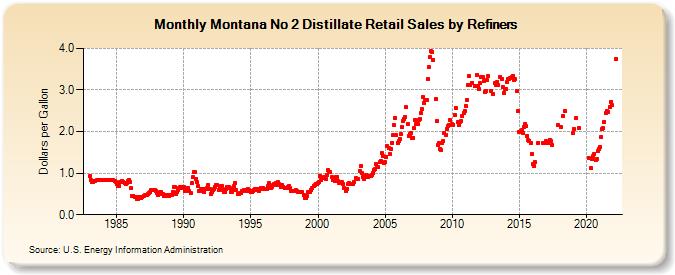
| Montana No 2 Distillate Retail Sales by Refiners (Dollars per Gallon) | ||||||||
| Year | Jan | Feb | Mar | Apr | May | Jun | Jul | Aug | Sep | Oct | Nov | Dec |
|---|---|---|---|---|---|---|---|---|---|---|---|---|
| 1983 | 0.920 | 0.833 | 0.789 | 0.795 | 0.799 | 0.812 | 0.825 | 0.828 | 0.830 | 0.838 | 0.838 | 0.832 |
| 1984 | 0.835 | 0.843 | 0.844 | 0.845 | 0.844 | 0.840 | 0.842 | 0.837 | 0.838 | 0.828 | 0.817 | 0.798 |
| 1985 | 0.742 | 0.698 | 0.697 | 0.777 | 0.796 | 0.812 | 0.788 | 0.751 | 0.739 | 0.755 | 0.805 | 0.831 |
| 1986 | 0.796 | 0.638 | 0.459 | 0.458 | 0.427 | 0.434 | 0.388 | 0.371 | 0.414 | 0.406 | 0.398 | 0.419 |
| 1987 | 0.442 | 0.467 | 0.475 | 0.484 | 0.502 | 0.522 | 0.540 | 0.584 | 0.603 | 0.603 | 0.602 | 0.582 |
| 1988 | 0.521 | 0.481 | 0.497 | 0.547 | 0.548 | 0.506 | 0.462 | 0.471 | 0.460 | 0.467 | 0.452 | 0.461 |
| 1989 | 0.465 | 0.483 | 0.548 | 0.665 | 0.658 | 0.505 | 0.544 | 0.587 | 0.645 | 0.656 | 0.653 | 0.663 |
| 1990 | 0.664 | 0.578 | 0.608 | 0.638 | 0.642 | 0.579 | 0.513 | 0.763 | 0.900 | 1.027 | 1.025 | 0.869 |
| 1991 | 0.780 | 0.689 | 0.574 | 0.628 | 0.627 | 0.566 | 0.547 | 0.628 | 0.623 | 0.653 | 0.709 | 0.610 |
| 1992 | 0.509 | 0.543 | 0.585 | 0.615 | 0.671 | 0.724 | 0.709 | 0.604 | 0.648 | 0.687 | 0.686 | 0.599 |
| 1993 | 0.546 | 0.558 | 0.618 | 0.657 | 0.660 | 0.639 | 0.558 | 0.558 | 0.598 | 0.687 | 0.768 | 0.593 |
| 1994 | 0.500 | 0.493 | 0.513 | 0.534 | 0.559 | 0.578 | 0.593 | 0.584 | 0.578 | 0.613 | 0.603 | 0.580 |
| 1995 | 0.543 | 0.542 | 0.571 | 0.584 | 0.629 | 0.622 | 0.594 | 0.572 | 0.617 | 0.638 | 0.636 | 0.635 |
| 1996 | 0.623 | 0.616 | 0.612 | 0.679 | 0.754 | 0.666 | 0.634 | 0.665 | 0.712 | 0.749 | 0.769 | 0.720 |
| 1997 | 0.776 | 0.742 | 0.711 | 0.664 | 0.717 | 0.678 | 0.635 | 0.635 | 0.651 | 0.666 | 0.696 | 0.641 |
| 1998 | 0.579 | 0.576 | 0.566 | 0.560 | 0.587 | 0.562 | 0.550 | 0.550 | 0.557 | 0.539 | 0.542 | 0.465 |
| 1999 | 0.405 | 0.413 | 0.453 | 0.544 | 0.554 | 0.555 | 0.587 | 0.634 | 0.697 | 0.707 | 0.744 | 0.737 |
| 2000 | 0.758 | 0.794 | 0.927 | 0.831 | 0.875 | 0.897 | 0.913 | 0.861 | 0.960 | 1.075 | 1.035 | 1.016 |
| 2001 | 0.902 | 0.833 | 0.840 | 0.822 | 0.903 | 0.910 | 0.801 | 0.769 | W | 0.792 | 0.750 | 0.640 |
| 2002 | NA | 0.560 | 0.627 | 0.727 | 0.751 | 0.749 | 0.728 | 0.743 | 0.795 | NA | 0.879 | NA |
| 2003 | 0.860 | 1.055 | 1.167 | 1.009 | 0.905 | 0.864 | 0.898 | 0.948 | 0.925 | 0.911 | 0.943 | 0.938 |
| 2004 | 0.961 | 0.992 | 1.084 | 1.101 | 1.209 | 1.154 | 1.150 | 1.258 | 1.298 | 1.490 | 1.415 | 1.240 |
| 2005 | 1.266 | 1.395 | 1.647 | 1.597 | 1.464 | 1.577 | 1.731 | 1.909 | 2.152 | 2.329 | 1.907 | 1.733 |
| 2006 | 1.765 | 1.821 | 1.932 | 2.114 | 2.248 | 2.298 | 2.338 | 2.579 | 2.179 | 1.894 | 1.938 | 1.961 |
| 2007 | 1.835 | 1.855 | 2.077 | 2.273 | 2.183 | 2.173 | 2.288 | 2.299 | 2.444 | 2.537 | 2.831 | 2.696 |
| 2008 | 2.751 | 2.754 | 3.263 | 3.561 | 3.787 | 3.930 | 3.918 | 3.730 | NA | 2.787 | 2.248 | 1.678 |
| 2009 | 1.715 | 1.582 | 1.551 | 1.733 | 1.771 | 1.963 | 1.928 | 2.072 | 2.125 | 2.158 | 2.286 | 2.162 |
| 2010 | 2.173 | 2.160 | 2.409 | 2.574 | NA | 2.224 | 2.160 | 2.219 | 2.257 | 2.377 | 2.456 | 2.503 |
| 2011 | 2.615 | 2.761 | 3.127 | 3.325 | 3.119 | NA | 3.165 | NA | 3.087 | NA | 3.362 | 3.089 |
| 2012 | 3.021 | 3.156 | 3.320 | 3.304 | 3.213 | 2.958 | 2.979 | 3.244 | 3.333 | NA | NA | 2.977 |
| 2013 | 2.912 | NA | 3.157 | 3.129 | 3.192 | 3.119 | NA | 3.308 | 3.264 | 3.077 | 2.936 | 3.022 |
| 2014 | 3.026 | 3.202 | 3.257 | 3.273 | 3.295 | 3.306 | 3.342 | 3.248 | 3.257 | NA | 2.982 | 2.489 |
| 2015 | 1.996 | 2.017 | 2.028 | 1.962 | 2.116 | 2.193 | 2.122 | 1.891 | 1.789 | 1.784 | 1.731 | 1.459 |
| 2016 | 1.228 | 1.172 | 1.258 | W | W | 1.736 | W | W | NA | 1.723 | W | 1.723 |
| 2017 | 1.765 | W | 1.717 | 1.808 | 1.778 | 1.681 | W | W | W | W | 2.156 | W |
| 2018 | W | 2.099 | W | 2.376 | W | 2.494 | W | W | W | W | W | W |
| 2019 | 1.969 | 2.066 | W | 2.327 | W | 2.089 | W | W | W | W | W | W |
| 2020 | W | W | 1.366 | W | 1.115 | 1.328 | 1.424 | 1.470 | 1.310 | 1.345 | 1.523 | 1.580 |
| 2021 | 1.632 | 1.864 | 2.051 | 2.083 | 2.232 | 2.437 | 2.503 | 2.481 | W | 2.590 | 2.718 | 2.632 |
| 2022 | W | W | 3.735 | |||||||||
| - = No Data Reported; -- = Not Applicable; NA = Not Available; W = Withheld to avoid disclosure of individual company data. |
| Release Date: 6/1/2022 |
| Next Release Date: TBD |