|
Download Data (XLS File) |
|
||||||||
|
||||||||
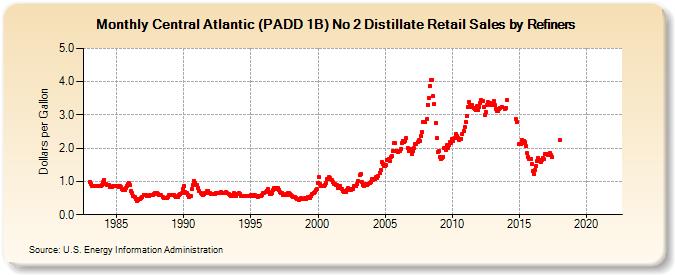
| Central Atlantic (PADD 1B) No 2 Distillate Retail Sales by Refiners (Dollars per Gallon) | ||||||||
| Year | Jan | Feb | Mar | Apr | May | Jun | Jul | Aug | Sep | Oct | Nov | Dec |
|---|---|---|---|---|---|---|---|---|---|---|---|---|
| 1983 | 0.980 | 0.934 | 0.871 | 0.858 | 0.870 | 0.859 | 0.852 | 0.861 | 0.874 | 0.876 | 0.878 | 0.893 |
| 1984 | 0.974 | 1.048 | 0.935 | 0.897 | 0.895 | 0.881 | 0.846 | 0.831 | 0.844 | 0.868 | 0.868 | 0.867 |
| 1985 | 0.871 | 0.863 | 0.848 | 0.854 | 0.829 | 0.787 | 0.752 | 0.754 | 0.816 | 0.861 | 0.911 | 0.941 |
| 1986 | 0.885 | 0.711 | 0.650 | 0.556 | 0.524 | 0.475 | 0.413 | 0.446 | 0.473 | 0.460 | 0.488 | 0.519 |
| 1987 | 0.590 | 0.606 | 0.583 | 0.560 | 0.563 | 0.569 | 0.586 | 0.597 | 0.589 | 0.623 | 0.646 | 0.651 |
| 1988 | 0.654 | 0.632 | 0.599 | 0.584 | 0.578 | 0.534 | 0.502 | 0.499 | 0.512 | 0.498 | 0.530 | 0.589 |
| 1989 | 0.593 | 0.578 | 0.606 | 0.606 | 0.569 | 0.532 | 0.532 | 0.539 | 0.584 | 0.636 | 0.640 | 0.788 |
| 1990 | 0.858 | 0.682 | 0.648 | 0.645 | 0.606 | 0.546 | 0.565 | 0.767 | 0.904 | 1.023 | 0.963 | 0.904 |
| 1991 | 0.883 | 0.805 | 0.709 | 0.655 | 0.618 | 0.603 | 0.622 | 0.645 | 0.659 | 0.706 | 0.725 | 0.652 |
| 1992 | 0.626 | 0.634 | 0.626 | 0.626 | 0.631 | 0.652 | 0.649 | 0.645 | 0.667 | 0.693 | 0.659 | 0.651 |
| 1993 | 0.638 | 0.658 | 0.671 | 0.638 | 0.618 | 0.599 | 0.567 | 0.573 | 0.596 | 0.640 | 0.619 | 0.556 |
| 1994 | 0.612 | 0.655 | 0.609 | 0.576 | 0.550 | 0.553 | 0.562 | 0.565 | 0.550 | 0.565 | 0.574 | 0.576 |
| 1995 | 0.584 | 0.579 | 0.554 | 0.570 | 0.579 | 0.550 | 0.535 | 0.548 | 0.571 | 0.558 | 0.593 | 0.646 |
| 1996 | 0.664 | 0.674 | 0.719 | 0.758 | 0.684 | 0.609 | 0.627 | 0.664 | 0.733 | 0.797 | 0.786 | 0.811 |
| 1997 | 0.804 | 0.752 | 0.671 | 0.659 | 0.660 | 0.607 | 0.596 | 0.615 | 0.600 | 0.644 | 0.650 | 0.624 |
| 1998 | 0.590 | 0.576 | 0.547 | 0.535 | 0.505 | 0.481 | 0.458 | 0.439 | 0.485 | 0.493 | 0.481 | 0.458 |
| 1999 | 0.489 | 0.459 | 0.506 | 0.532 | 0.519 | 0.510 | 0.571 | 0.610 | 0.661 | 0.671 | 0.730 | 0.764 |
| 2000 | 0.961 | 1.126 | 0.915 | 0.874 | 0.876 | 0.870 | 0.886 | 0.948 | 1.081 | 1.081 | 1.120 | 1.089 |
| 2001 | 1.037 | 0.973 | 0.910 | 0.912 | 0.903 | 0.882 | 0.815 | 0.827 | 0.864 | 0.767 | 0.708 | 0.680 |
| 2002 | 0.704 | 0.691 | 0.754 | 0.789 | 0.782 | 0.751 | 0.765 | 0.786 | 0.855 | 0.876 | 0.858 | 0.919 |
| 2003 | 1.005 | 1.191 | 1.226 | 0.991 | 0.907 | 0.878 | 0.898 | 0.925 | 0.886 | 0.934 | 0.945 | 0.995 |
| 2004 | 1.062 | 1.057 | 1.067 | 1.078 | 1.123 | 1.116 | 1.171 | 1.269 | 1.349 | 1.582 | 1.537 | 1.460 |
| 2005 | 1.467 | 1.485 | 1.648 | 1.680 | 1.606 | 1.730 | 1.765 | 1.915 | 2.152 | 2.154 | 1.908 | 1.889 |
| 2006 | 1.923 | 1.910 | 1.975 | 2.152 | 2.222 | 2.181 | 2.223 | 2.302 | 2.010 | 1.903 | 1.908 | 1.970 |
| 2007 | 1.822 | 1.929 | 1.991 | 2.112 | 2.121 | 2.174 | 2.243 | 2.204 | 2.360 | 2.498 | 2.800 | 2.784 |
| 2008 | 2.784 | 2.872 | 3.311 | 3.520 | 3.874 | 4.060 | 4.064 | 3.554 | 3.330 | 2.767 | 2.293 | 1.884 |
| 2009 | 1.914 | 1.749 | 1.677 | 1.712 | 1.748 | 2.004 | 1.938 | 2.088 | 2.009 | 2.110 | 2.171 | 2.164 |
| 2010 | 2.271 | 2.211 | 2.305 | 2.426 | 2.373 | 2.307 | 2.232 | 2.275 | 2.282 | 2.432 | 2.515 | 2.643 |
| 2011 | 2.798 | 2.955 | 3.233 | 3.398 | 3.297 | 3.236 | 3.286 | 3.204 | 3.172 | 3.156 | 3.260 | 3.142 |
| 2012 | 3.250 | 3.366 | 3.453 | 3.430 | 3.241 | 2.983 | 3.082 | 3.291 | 3.377 | 3.365 | 3.360 | 3.297 |
| 2013 | 3.286 | 3.425 | 3.299 | 3.176 | 3.129 | 3.114 | 3.179 | 3.218 | 3.234 | NA | NA | 3.182 |
| 2014 | 3.211 | 3.446 | W | W | W | W | W | W | W | 2.876 | 2.786 | W |
| 2015 | 2.117 | 2.127 | 2.253 | 2.146 | 2.231 | 2.177 | 2.057 | 1.844 | 1.740 | 1.688 | 1.668 | 1.512 |
| 2016 | 1.316 | 1.221 | 1.345 | 1.457 | 1.605 | 1.701 | 1.642 | 1.599 | 1.642 | 1.719 | 1.661 | 1.815 |
| 2017 | 1.828 | 1.819 | 1.782 | 1.843 | 1.798 | 1.725 | W | W | W | W | W | W |
| 2018 | 2.238 | W | W | W | W | W | W | W | W | W | W | W |
| 2019 | W | W | W | W | W | W | W | W | W | W | W | W |
| 2020 | W | W | W | W | W | W | W | W | W | W | W | W |
| 2021 | W | W | W | W | W | W | W | W | W | W | W | W |
| 2022 | W | W | W | |||||||||
| - = No Data Reported; -- = Not Applicable; NA = Not Available; W = Withheld to avoid disclosure of individual company data. |
| Release Date: 6/1/2022 |
| Next Release Date: TBD |