|
Download Data (XLS File) |
|
||||||||
|
||||||||
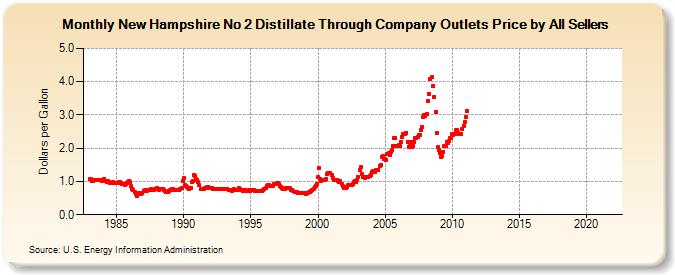
| New Hampshire No 2 Distillate Through Company Outlets Price by All Sellers (Dollars per Gallon) | ||||||||
| Year | Jan | Feb | Mar | Apr | May | Jun | Jul | Aug | Sep | Oct | Nov | Dec |
|---|---|---|---|---|---|---|---|---|---|---|---|---|
| 1983 | 1.084 | 1.080 | 1.021 | 1.014 | 1.033 | 1.030 | 1.037 | 1.034 | 1.043 | 1.032 | 1.029 | 1.013 |
| 1984 | 1.038 | 1.085 | 1.000 | 0.994 | 1.000 | 0.974 | 0.957 | 0.949 | 0.955 | 0.969 | 0.960 | 0.960 |
| 1985 | 0.952 | 0.962 | 0.970 | 0.977 | 0.942 | 0.911 | 0.914 | 0.899 | 0.929 | 0.954 | 0.984 | 1.012 |
| 1986 | 0.975 | 0.849 | 0.780 | 0.730 | 0.684 | 0.635 | 0.574 | 0.624 | 0.645 | 0.609 | 0.621 | 0.643 |
| 1987 | 0.725 | 0.734 | 0.730 | 0.719 | 0.734 | 0.746 | 0.756 | 0.764 | 0.750 | 0.745 | 0.761 | 0.780 |
| 1988 | 0.790 | 0.760 | 0.742 | 0.761 | 0.762 | 0.762 | 0.730 | 0.711 | 0.687 | 0.672 | 0.677 | 0.715 |
| 1989 | 0.753 | 0.784 | 0.772 | 0.737 | 0.742 | 0.743 | 0.738 | 0.742 | 0.757 | 0.785 | 0.800 | 1.005 |
| 1990 | 1.103 | 0.883 | 0.857 | 0.842 | 0.816 | 0.774 | 0.798 | 0.969 | 1.028 | 1.186 | 1.174 | 1.068 |
| 1991 | 1.049 | 0.969 | 0.881 | 0.778 | 0.762 | 0.760 | 0.777 | 0.795 | 0.803 | 0.829 | 0.841 | 0.810 |
| 1992 | 0.797 | 0.789 | 0.763 | 0.759 | 0.768 | 0.784 | 0.781 | 0.784 | 0.786 | 0.786 | 0.781 | 0.775 |
| 1993 | 0.778 | 0.770 | 0.779 | 0.782 | 0.752 | 0.740 | 0.730 | 0.724 | 0.738 | 0.770 | 0.753 | 0.754 |
| 1994 | 0.752 | 0.795 | 0.776 | NA | 0.750 | 0.701 | 0.712 | 0.728 | 0.725 | 0.722 | 0.735 | 0.711 |
| 1995 | 0.744 | 0.734 | 0.738 | 0.733 | 0.717 | 0.724 | 0.707 | 0.706 | 0.716 | 0.714 | 0.717 | 0.752 |
| 1996 | 0.781 | 0.798 | 0.861 | 0.905 | 0.888 | 0.865 | 0.850 | 0.854 | 0.878 | 0.929 | 0.933 | 0.948 |
| 1997 | 0.945 | 0.924 | 0.860 | 0.823 | 0.805 | 0.786 | 0.786 | 0.793 | 0.794 | 0.804 | 0.805 | 0.791 |
| 1998 | 0.752 | 0.738 | 0.698 | 0.695 | 0.675 | 0.668 | 0.655 | 0.640 | 0.647 | 0.657 | 0.654 | 0.657 |
| 1999 | 0.648 | 0.637 | 0.642 | 0.665 | 0.675 | 0.674 | 0.719 | 0.750 | 0.788 | 0.826 | 0.871 | 0.926 |
| 2000 | 1.124 | 1.399 | 1.088 | 1.013 | 1.029 | 1.034 | 1.039 | 1.083 | 1.221 | 1.240 | 1.255 | 1.246 |
| 2001 | 1.181 | 1.108 | 1.038 | 1.052 | 1.052 | 1.046 | 0.999 | 0.982 | 1.000 | 0.929 | 0.849 | 0.800 |
| 2002 | 0.796 | 0.795 | 0.846 | 0.904 | 0.906 | 0.897 | 0.903 | 0.926 | 0.979 | 1.008 | 0.993 | 1.032 |
| 2003 | 1.119 | 1.337 | 1.425 | 1.214 | 1.138 | 1.119 | 1.099 | 1.123 | 1.122 | 1.128 | 1.150 | 1.200 |
| 2004 | 1.298 | 1.309 | 1.312 | 1.290 | 1.334 | 1.339 | 1.357 | 1.466 | 1.488 | 1.725 | 1.758 | 1.680 |
| 2005 | 1.661 | 1.657 | 1.826 | 1.843 | 1.809 | 1.891 | 1.952 | 2.076 | 2.305 | 2.314 | 2.080 | 2.073 |
| 2006 | 2.088 | 2.076 | 2.179 | 2.341 | 2.428 | 2.419 | 2.441 | 2.471 | 2.200 | 2.045 | 2.071 | 2.173 |
| 2007 | 2.045 | 2.070 | 2.180 | 2.297 | 2.320 | 2.339 | 2.406 | 2.390 | 2.540 | 2.646 | 2.937 | 3.001 |
| 2008 | 2.971 | 3.027 | 3.412 | 3.625 | 4.089 | NA | 4.138 | 3.879 | 3.553 | 3.101 | 2.465 | 2.024 |
| 2009 | 1.933 | 1.852 | 1.740 | 1.757 | 1.888 | 2.069 | 2.055 | 2.174 | 2.163 | 2.205 | 2.293 | 2.307 |
| 2010 | 2.430 | 2.397 | 2.437 | 2.532 | 2.537 | 2.458 | 2.427 | 2.431 | 2.428 | 2.573 | 2.666 | 2.791 |
| 2011 | 2.933 | 3.131 | - | - | - | - | - | - | - | - | - | - |
| 2012 | - | - | - | - | - | - | - | - | - | - | - | - |
| 2013 | - | - | - | - | - | - | - | - | - | - | - | - |
| 2014 | - | - | - | - | - | - | - | - | - | - | - | - |
| 2015 | - | - | - | - | - | - | - | - | - | - | - | - |
| 2016 | - | - | - | - | - | - | - | - | - | - | - | - |
| 2017 | - | - | - | - | - | - | - | - | - | - | - | - |
| 2018 | - | - | - | - | - | - | - | - | - | - | - | - |
| 2019 | - | - | - | - | - | - | - | - | - | - | - | - |
| 2020 | - | - | - | - | - | - | - | - | - | - | - | - |
| 2021 | - | - | - | - | - | - | - | - | - | - | - | - |
| 2022 | - | - | - | |||||||||
| - = No Data Reported; -- = Not Applicable; NA = Not Available; W = Withheld to avoid disclosure of individual company data. |
| Release Date: 6/1/2022 |
| Next Release Date: TBD |