|
Download Data (XLS File) |
|
||||||||
|
||||||||
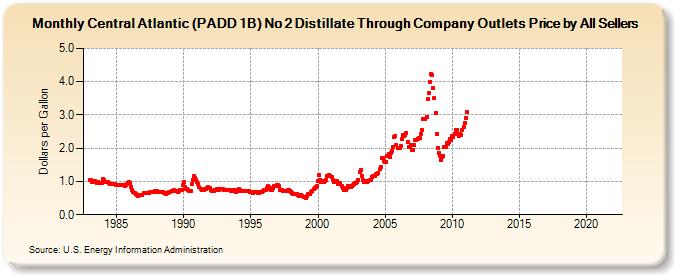
| Central Atlantic (PADD 1B) No 2 Distillate Through Company Outlets Price by All Sellers (Dollars per Gallon) | ||||||||
| Year | Jan | Feb | Mar | Apr | May | Jun | Jul | Aug | Sep | Oct | Nov | Dec |
|---|---|---|---|---|---|---|---|---|---|---|---|---|
| 1983 | 1.051 | 1.038 | 0.989 | 0.986 | 0.986 | 1.000 | 0.964 | 0.982 | 0.950 | 0.956 | 0.946 | 0.940 |
| 1984 | 1.080 | 1.031 | 0.983 | 0.986 | 0.975 | 0.967 | 0.933 | 0.926 | 0.915 | 0.920 | 0.909 | 0.902 |
| 1985 | 0.898 | 0.894 | 0.892 | 0.908 | 0.898 | 0.892 | 0.880 | 0.875 | 0.888 | 0.927 | 0.960 | 0.981 |
| 1986 | 0.941 | 0.828 | 0.747 | 0.682 | 0.663 | 0.621 | 0.595 | 0.572 | 0.580 | 0.582 | 0.588 | 0.598 |
| 1987 | 0.646 | 0.661 | 0.658 | 0.648 | 0.654 | 0.661 | 0.673 | 0.681 | 0.684 | 0.692 | 0.712 | 0.701 |
| 1988 | 0.710 | 0.694 | 0.676 | 0.680 | 0.687 | 0.675 | 0.665 | 0.656 | 0.627 | 0.639 | 0.658 | 0.682 |
| 1989 | 0.694 | 0.710 | 0.705 | 0.732 | 0.724 | 0.719 | 0.698 | 0.688 | 0.702 | 0.728 | 0.737 | 0.892 |
| 1990 | 0.989 | 0.834 | 0.787 | 0.770 | 0.749 | 0.727 | 0.722 | 0.910 | 1.040 | 1.149 | 1.105 | 1.046 |
| 1991 | 0.997 | 0.916 | 0.830 | 0.785 | 0.756 | 0.736 | 0.729 | 0.764 | 0.771 | 0.793 | 0.833 | 0.796 |
| 1992 | 0.735 | 0.719 | 0.715 | 0.717 | 0.729 | 0.752 | 0.760 | 0.757 | 0.762 | 0.781 | 0.781 | 0.768 |
| 1993 | 0.750 | 0.748 | 0.754 | 0.757 | 0.741 | 0.736 | 0.715 | 0.706 | 0.721 | 0.747 | 0.746 | 0.696 |
| 1994 | 0.715 | 0.762 | 0.740 | 0.715 | 0.699 | 0.698 | 0.702 | 0.711 | 0.704 | 0.701 | 0.702 | 0.696 |
| 1995 | 0.695 | 0.677 | 0.663 | 0.671 | 0.687 | 0.680 | 0.665 | 0.665 | 0.672 | 0.671 | 0.675 | 0.703 |
| 1996 | 0.740 | 0.747 | 0.795 | 0.865 | 0.835 | 0.770 | 0.739 | 0.751 | 0.805 | 0.874 | 0.877 | 0.890 |
| 1997 | 0.884 | 0.850 | 0.755 | 0.745 | 0.739 | 0.719 | 0.712 | 0.715 | 0.707 | 0.740 | 0.733 | 0.712 |
| 1998 | 0.690 | 0.655 | 0.635 | 0.633 | 0.630 | 0.608 | 0.586 | 0.568 | 0.584 | 0.592 | 0.572 | 0.541 |
| 1999 | 0.533 | 0.516 | 0.555 | 0.625 | 0.620 | 0.622 | 0.683 | 0.712 | 0.763 | 0.789 | 0.831 | 0.863 |
| 2000 | 1.003 | 1.200 | 1.037 | 0.989 | 1.007 | 0.996 | 1.001 | 1.052 | 1.176 | 1.176 | 1.197 | 1.174 |
| 2001 | 1.127 | 1.056 | 0.978 | 1.013 | 1.011 | 0.999 | 0.934 | 0.932 | 0.964 | 0.868 | 0.794 | 0.739 |
| 2002 | 0.747 | 0.751 | 0.795 | 0.853 | 0.863 | 0.844 | 0.852 | 0.879 | 0.934 | 0.965 | 0.944 | 0.974 |
| 2003 | 1.052 | 1.281 | 1.357 | 1.157 | 1.049 | 0.990 | 0.988 | 1.023 | 0.998 | 1.022 | 1.029 | 1.058 |
| 2004 | 1.140 | 1.167 | 1.175 | 1.175 | 1.234 | 1.232 | 1.263 | 1.360 | 1.449 | 1.691 | 1.705 | 1.617 |
| 2005 | 1.576 | 1.598 | 1.751 | 1.817 | 1.748 | 1.852 | 1.923 | 2.032 | 2.322 | 2.363 | 2.081 | 1.997 |
| 2006 | 2.007 | 1.993 | 2.072 | 2.274 | 2.394 | 2.370 | 2.391 | 2.468 | 2.194 | 2.026 | 2.031 | 2.106 |
| 2007 | 1.938 | 1.959 | 2.093 | 2.254 | 2.257 | 2.285 | 2.321 | 2.300 | 2.430 | 2.558 | 2.875 | 2.886 |
| 2008 | 2.863 | 2.934 | 3.465 | 3.659 | 4.001 | 4.222 | 4.205 | 3.805 | 3.499 | 3.055 | 2.434 | 2.019 |
| 2009 | 1.870 | 1.767 | 1.659 | 1.733 | 1.765 | 2.044 | 2.037 | 2.145 | 2.112 | 2.181 | 2.289 | 2.255 |
| 2010 | 2.372 | 2.330 | 2.436 | 2.548 | 2.554 | 2.440 | 2.380 | 2.413 | 2.409 | 2.547 | 2.644 | 2.749 |
| 2011 | 2.912 | 3.088 | - | - | - | - | - | - | - | - | - | - |
| 2012 | - | - | - | - | - | - | - | - | - | - | - | - |
| 2013 | - | - | - | - | - | - | - | - | - | - | - | - |
| 2014 | - | - | - | - | - | - | - | - | - | - | - | - |
| 2015 | - | - | - | - | - | - | - | - | - | - | - | - |
| 2016 | - | - | - | - | - | - | - | - | - | - | - | - |
| 2017 | - | - | - | - | - | - | - | - | - | - | - | - |
| 2018 | - | - | - | - | - | - | - | - | - | - | - | - |
| 2019 | - | - | - | - | - | - | - | - | - | - | - | - |
| 2020 | - | - | - | - | - | - | - | - | - | - | - | - |
| 2021 | - | - | - | - | - | - | - | - | - | - | - | - |
| 2022 | - | - | - | |||||||||
| - = No Data Reported; -- = Not Applicable; NA = Not Available; W = Withheld to avoid disclosure of individual company data. |
| Release Date: 6/1/2022 |
| Next Release Date: TBD |