|
Download Data (XLS File) |
|
||||||||
|
||||||||
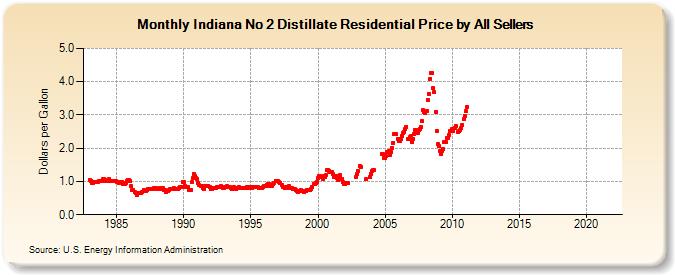
| Indiana No 2 Distillate Residential Price by All Sellers (Dollars per Gallon) | ||||||||
| Year | Jan | Feb | Mar | Apr | May | Jun | Jul | Aug | Sep | Oct | Nov | Dec |
|---|---|---|---|---|---|---|---|---|---|---|---|---|
| 1983 | 1.057 | 1.028 | 0.957 | 0.968 | 0.982 | 0.982 | 0.994 | 0.989 | 1.014 | 1.015 | 1.007 | 1.011 |
| 1984 | 1.060 | 1.073 | 1.006 | 1.034 | 1.024 | 1.059 | 1.014 | 1.003 | 1.007 | 1.009 | 1.023 | 1.009 |
| 1985 | 0.986 | 0.978 | 0.963 | 0.986 | 0.974 | 0.976 | 0.933 | 0.929 | 0.965 | 1.012 | 1.053 | 1.053 |
| 1986 | 0.999 | 0.850 | 0.756 | 0.740 | 0.672 | 0.666 | 0.601 | 0.656 | 0.667 | 0.652 | 0.651 | 0.685 |
| 1987 | 0.730 | 0.723 | 0.712 | 0.731 | 0.758 | 0.759 | 0.767 | 0.771 | 0.771 | 0.794 | 0.808 | 0.796 |
| 1988 | 0.783 | 0.767 | 0.774 | 0.790 | 0.766 | 0.801 | 0.740 | 0.741 | 0.695 | 0.712 | 0.721 | 0.753 |
| 1989 | 0.778 | 0.770 | 0.776 | 0.797 | 0.781 | 0.765 | 0.770 | 0.765 | 0.801 | 0.833 | 0.840 | 0.986 |
| 1990 | 0.998 | 0.862 | 0.838 | 0.841 | 0.824 | 0.728 | 0.747 | 0.980 | 1.107 | 1.233 | 1.178 | 1.113 |
| 1991 | 1.059 | 0.954 | 0.879 | 0.860 | 0.863 | 0.803 | 0.788 | 0.855 | 0.855 | 0.867 | 0.878 | 0.833 |
| 1992 | 0.778 | 0.787 | 0.795 | 0.802 | 0.812 | 0.796 | 0.824 | 0.831 | 0.848 | 0.858 | 0.827 | 0.818 |
| 1993 | 0.818 | 0.823 | 0.831 | 0.849 | 0.836 | 0.820 | 0.791 | 0.767 | 0.793 | 0.827 | 0.802 | 0.771 |
| 1994 | 0.791 | 0.820 | 0.810 | 0.812 | 0.799 | 0.815 | 0.800 | 0.816 | 0.826 | 0.817 | 0.812 | 0.824 |
| 1995 | 0.816 | 0.801 | 0.823 | 0.823 | 0.836 | 0.835 | 0.819 | 0.794 | 0.809 | 0.818 | 0.792 | 0.836 |
| 1996 | 0.856 | 0.864 | 0.907 | 0.935 | 0.930 | 0.862 | 0.856 | 0.874 | 0.928 | 0.966 | 1.024 | 1.008 |
| 1997 | 1.009 | 0.970 | 0.947 | NA | 0.887 | 0.842 | 0.799 | 0.832 | 0.804 | 0.845 | 0.850 | 0.818 |
| 1998 | 0.799 | 0.789 | 0.779 | 0.770 | 0.732 | 0.721 | 0.697 | 0.710 | 0.725 | 0.730 | 0.719 | 0.693 |
| 1999 | 0.714 | 0.710 | 0.737 | 0.756 | 0.729 | 0.740 | 0.763 | 0.845 | 0.917 | 0.909 | 0.968 | 0.993 |
| 2000 | 1.096 | 1.161 | 1.176 | 1.124 | 1.086 | 1.151 | 1.123 | 1.188 | 1.340 | 1.350 | 1.315 | 1.270 |
| 2001 | 1.270 | 1.231 | 1.141 | 1.123 | 1.178 | 1.098 | 1.029 | 1.117 | 1.180 | 1.083 | 0.982 | 0.934 |
| 2002 | 0.917 | 0.957 | 0.939 | 0.949 | W | W | W | W | W | W | 1.140 | 1.210 |
| 2003 | 1.303 | 1.467 | 1.424 | W | W | W | W | 1.060 | W | W | 1.128 | 1.230 |
| 2004 | 1.301 | 1.333 | 1.340 | W | W | W | W | W | W | 1.836 | 1.816 | 1.712 |
| 2005 | 1.716 | 1.754 | 1.880 | 1.907 | 1.798 | 1.900 | 2.009 | 2.170 | 2.419 | NA | 2.433 | 2.279 |
| 2006 | 2.224 | 2.217 | 2.280 | 2.381 | 2.464 | 2.495 | 2.569 | 2.649 | 2.275 | 2.272 | 2.328 | 2.364 |
| 2007 | 2.182 | 2.284 | 2.426 | 2.555 | 2.460 | 2.467 | 2.552 | 2.585 | 2.637 | 2.808 | 3.133 | 3.096 |
| 2008 | 3.063 | 3.123 | 3.453 | 3.643 | 4.091 | 4.274 | 4.264 | 3.797 | 3.688 | 3.098 | 2.526 | 2.118 |
| 2009 | 2.062 | 1.912 | 1.822 | 1.922 | 1.972 | 2.176 | 2.181 | 2.321 | 2.318 | 2.391 | 2.520 | 2.507 |
| 2010 | 2.565 | 2.510 | 2.614 | 2.679 | NA | 2.482 | 2.510 | 2.550 | 2.607 | 2.701 | 2.864 | 2.979 |
| 2011 | 3.109 | 3.246 | - | - | - | - | - | - | - | - | - | - |
| 2012 | - | - | - | - | - | - | - | - | - | - | - | - |
| 2013 | - | - | - | - | - | - | - | - | - | - | - | - |
| 2014 | - | - | - | - | - | - | - | - | - | - | - | - |
| 2015 | - | - | - | - | - | - | - | - | - | - | - | - |
| 2016 | - | - | - | - | - | - | - | - | - | - | - | - |
| 2017 | - | - | - | - | - | - | - | - | - | - | - | - |
| 2018 | - | - | - | - | - | - | - | - | - | - | - | - |
| 2019 | - | - | - | - | - | - | - | - | - | - | - | - |
| 2020 | - | - | - | - | - | - | - | - | - | - | - | - |
| 2021 | - | - | - | - | - | - | - | - | - | - | - | - |
| 2022 | - | - | - | |||||||||
| - = No Data Reported; -- = Not Applicable; NA = Not Available; W = Withheld to avoid disclosure of individual company data. |
| Release Date: 6/1/2022 |
| Next Release Date: TBD |