|
Download Data (XLS File) |
|
||||||||
|
||||||||
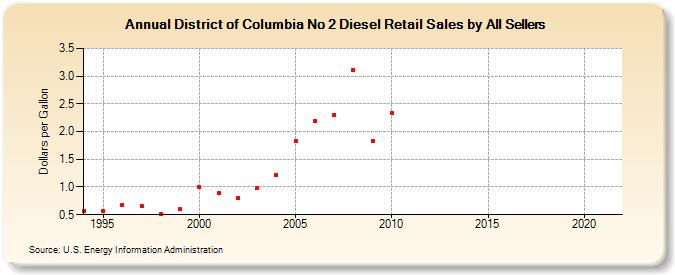
| District of Columbia No 2 Diesel Retail Sales by All Sellers (Dollars per Gallon) | ||||||||
| Decade | Year-0 | Year-1 | Year-2 | Year-3 | Year-4 | Year-5 | Year-6 | Year-7 | Year-8 | Year-9 |
|---|---|---|---|---|---|---|---|---|---|---|
| 1990's | 0.569 | 0.570 | 0.676 | 0.666 | 0.515 | 0.606 | ||||
| 2000's | 0.991 | 0.889 | 0.807 | 0.976 | 1.223 | 1.828 | 2.183 | 2.304 | 3.117 | 1.830 |
| 2010's | 2.341 | - | - | - | - | - | - | - | - | - |
| 2020's | - |
| - = No Data Reported; -- = Not Applicable; NA = Not Available; W = Withheld to avoid disclosure of individual company data. |
| Release Date: 6/1/2022 |
| Next Release Date: TBD |