|
Download Data (XLS File) |
|
||||||||
|
||||||||
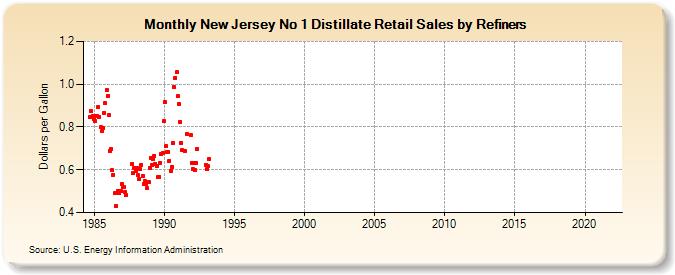
| New Jersey No 1 Distillate Retail Sales by Refiners (Dollars per Gallon) | ||||||||
| Year | Jan | Feb | Mar | Apr | May | Jun | Jul | Aug | Sep | Oct | Nov | Dec |
|---|---|---|---|---|---|---|---|---|---|---|---|---|
| 1984 | 0.844 | 0.872 | 0.852 | 0.836 | ||||||||
| 1985 | 0.828 | 0.852 | 0.852 | 0.893 | 0.847 | 0.798 | 0.781 | 0.793 | 0.866 | 0.910 | 0.970 | 0.945 |
| 1986 | 0.855 | 0.689 | 0.696 | 0.597 | 0.577 | 0.489 | 0.431 | 0.491 | 0.502 | 0.493 | 0.500 | 0.534 |
| 1987 | 0.517 | 0.517 | 0.497 | 0.481 | W | W | W | W | 0.627 | 0.587 | 0.610 | 0.595 |
| 1988 | 0.610 | 0.574 | 0.556 | 0.604 | 0.621 | 0.571 | 0.535 | 0.546 | 0.535 | 0.513 | 0.543 | 0.607 |
| 1989 | 0.656 | 0.621 | 0.649 | 0.666 | 0.627 | 0.616 | 0.564 | 0.567 | 0.633 | 0.675 | 0.678 | 0.826 |
| 1990 | 0.915 | 0.709 | 0.682 | 0.684 | 0.641 | 0.596 | 0.615 | 0.726 | 0.984 | 1.030 | 1.054 | 0.944 |
| 1991 | 0.907 | 0.823 | 0.726 | 0.690 | W | 0.688 | W | 0.769 | W | W | 0.760 | 0.633 |
| 1992 | 0.602 | 0.630 | 0.600 | 0.631 | 0.699 | W | W | W | W | W | W | 0.624 |
| 1993 | 0.602 | 0.616 | 0.651 | W | W | W | W | W | W | - | - | W |
| 1994 | W | W | W | W | - | - | - | - | - | - | W | W |
| 1995 | W | W | W | - | - | - | - | - | - | W | W | W |
| 1996 | W | W | W | - | - | - | - | - | - | W | W | W |
| 1997 | W | W | W | - | - | - | - | - | - | - | W | W |
| 1998 | W | W | W | NA | NA | NA | NA | NA | W | NA | NA | W |
| 1999 | W | W | W | W | - | - | - | - | - | W | W | W |
| 2000 | W | - | - | W | - | - | - | - | - | - | W | W |
| 2001 | W | W | W | W | W | W | W | - | - | - | - | W |
| 2002 | W | W | W | W | - | - | - | - | - | - | - | W |
| 2003 | W | W | W | W | - | - | W | W | - | W | W | - |
| 2004 | W | W | W | W | W | W | W | W | W | W | W | W |
| 2005 | W | W | W | W | W | W | W | W | W | - | W | W |
| 2006 | W | - | - | - | - | - | - | - | - | - | - | - |
| 2007 | - | - | - | - | - | - | - | - | - | - | - | - |
| 2008 | - | - | - | - | - | - | - | - | - | - | - | - |
| 2009 | - | - | - | - | - | - | - | - | - | - | - | - |
| 2010 | - | - | - | - | - | - | - | - | - | - | - | - |
| 2011 | - | - | - | - | - | - | - | - | - | - | - | - |
| 2012 | - | - | - | - | - | - | - | - | - | - | - | - |
| 2013 | - | - | - | - | - | - | - | - | - | - | - | - |
| 2014 | - | - | - | - | - | - | - | - | - | - | - | - |
| 2015 | - | - | - | - | - | - | - | - | - | - | - | - |
| 2016 | - | - | - | - | - | - | - | - | - | - | - | - |
| 2017 | - | - | - | - | - | - | - | - | - | - | - | - |
| 2018 | - | - | - | - | - | - | - | - | - | - | - | - |
| 2019 | - | - | - | - | - | - | - | - | - | - | - | - |
| 2020 | - | - | - | - | - | - | - | - | - | - | - | - |
| 2021 | - | - | - | - | - | - | - | - | - | - | - | - |
| 2022 | - | - | - | |||||||||
| - = No Data Reported; -- = Not Applicable; NA = Not Available; W = Withheld to avoid disclosure of individual company data. |
| Release Date: 6/1/2022 |
| Next Release Date: TBD |