|
Download Data (XLS File) |
|
||||||||||||
|
||||||||||||
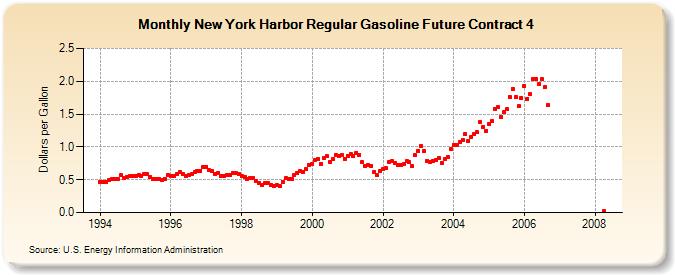
| New York Harbor Regular Gasoline Future Contract 4 (Dollars per Gallon) | ||||||||||||
| Year | Jan | Feb | Mar | Apr | May | Jun | Jul | Aug | Sep | Oct | Nov | Dec |
|---|---|---|---|---|---|---|---|---|---|---|---|---|
| 1994 | 0.469 | 0.470 | 0.466 | 0.495 | 0.509 | 0.513 | 0.518 | 0.565 | 0.531 | 0.547 | 0.552 | 0.553 |
| 1995 | 0.561 | 0.569 | 0.558 | 0.584 | 0.582 | 0.538 | 0.506 | 0.514 | 0.517 | 0.498 | 0.516 | 0.567 |
| 1996 | 0.560 | 0.560 | 0.587 | 0.616 | 0.585 | 0.555 | 0.568 | 0.580 | 0.611 | 0.640 | 0.639 | 0.693 |
| 1997 | 0.701 | 0.644 | 0.629 | 0.591 | 0.604 | 0.555 | 0.560 | 0.574 | 0.568 | 0.602 | 0.597 | 0.589 |
| 1998 | 0.550 | 0.538 | 0.515 | 0.530 | 0.523 | 0.483 | 0.453 | 0.426 | 0.454 | 0.451 | 0.425 | 0.404 |
| 1999 | 0.415 | 0.401 | 0.471 | 0.521 | 0.514 | 0.512 | 0.573 | 0.600 | 0.639 | 0.620 | 0.663 | 0.717 |
| 2000 | 0.745 | 0.803 | 0.815 | 0.745 | 0.830 | 0.856 | 0.777 | 0.811 | 0.876 | 0.864 | 0.874 | 0.822 |
| 2001 | 0.863 | 0.890 | 0.856 | 0.907 | 0.881 | 0.766 | 0.710 | 0.727 | 0.709 | 0.622 | 0.568 | 0.631 |
| 2002 | 0.658 | 0.671 | 0.773 | 0.780 | 0.758 | 0.720 | 0.728 | 0.738 | 0.778 | 0.766 | 0.708 | 0.869 |
| 2003 | 0.939 | 1.010 | 0.932 | 0.792 | 0.776 | 0.791 | 0.805 | 0.825 | 0.758 | 0.816 | 0.848 | 0.961 |
| 2004 | 1.030 | 1.034 | 1.074 | 1.099 | 1.200 | 1.090 | 1.154 | 1.191 | 1.221 | 1.386 | 1.304 | 1.246 |
| 2005 | 1.346 | 1.393 | 1.584 | 1.602 | 1.456 | 1.525 | 1.570 | 1.765 | 1.888 | 1.763 | 1.616 | 1.742 |
| 2006 | 1.930 | 1.733 | 1.801 | 2.035 | 2.028 | 1.955 | 2.029 | 1.907 | 1.637 | |||
| 2008 | 0.017 | |||||||||||
| - = No Data Reported; -- = Not Applicable; NA = Not Available; W = Withheld to avoid disclosure of individual company data. |
| Release Date: 4/10/2024 |
| Next Release Date: 4/17/2024 |
Referring Pages: