|
Download Data (XLS File) |
|
||||||||||||
|
||||||||||||
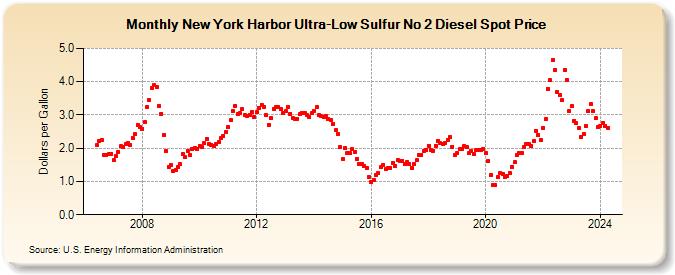
| New York Harbor Ultra-Low Sulfur No 2 Diesel Spot Price (Dollars per Gallon) | ||||||||||||
| Year | Jan | Feb | Mar | Apr | May | Jun | Jul | Aug | Sep | Oct | Nov | Dec |
|---|---|---|---|---|---|---|---|---|---|---|---|---|
| 2006 | 2.091 | 2.217 | 2.247 | 1.810 | 1.794 | 1.811 | 1.833 | |||||
| 2007 | 1.630 | 1.759 | 1.891 | 2.053 | 2.044 | 2.120 | 2.146 | 2.106 | 2.320 | 2.417 | 2.700 | 2.631 |
| 2008 | 2.590 | 2.774 | 3.253 | 3.443 | 3.821 | 3.887 | 3.845 | 3.273 | 3.041 | 2.397 | 1.923 | 1.436 |
| 2009 | 1.496 | 1.306 | 1.338 | 1.449 | 1.520 | 1.820 | 1.722 | 1.927 | 1.795 | 1.982 | 1.998 | 1.980 |
| 2010 | 2.066 | 2.035 | 2.159 | 2.284 | 2.136 | 2.108 | 2.066 | 2.122 | 2.175 | 2.301 | 2.377 | 2.500 |
| 2011 | 2.642 | 2.840 | 3.131 | 3.271 | 3.035 | 3.054 | 3.170 | 3.010 | 2.980 | 3.008 | 3.095 | 2.937 |
| 2012 | 3.080 | 3.223 | 3.302 | 3.242 | 2.987 | 2.710 | 2.921 | 3.179 | 3.229 | 3.236 | 3.180 | 3.070 |
| 2013 | 3.103 | 3.237 | 3.037 | 2.900 | 2.888 | 2.891 | 3.018 | 3.068 | 3.048 | 2.995 | 2.938 | 3.045 |
| 2014 | 3.117 | 3.227 | 2.993 | 2.958 | 2.936 | 2.962 | 2.879 | 2.850 | 2.740 | 2.532 | 2.430 | 2.034 |
| 2015 | 1.678 | 1.991 | 1.856 | 1.843 | 1.965 | 1.888 | 1.684 | 1.516 | 1.516 | 1.472 | 1.413 | 1.138 |
| 2016 | 0.979 | 1.036 | 1.190 | 1.247 | 1.423 | 1.491 | 1.370 | 1.399 | 1.418 | 1.559 | 1.463 | 1.642 |
| 2017 | 1.623 | 1.624 | 1.528 | 1.586 | 1.514 | 1.417 | 1.521 | 1.631 | 1.791 | 1.799 | 1.916 | 1.944 |
| 2018 | 2.074 | 1.937 | 1.930 | 2.079 | 2.230 | 2.146 | 2.140 | 2.153 | 2.252 | 2.332 | 2.048 | 1.801 |
| 2019 | 1.846 | 1.962 | 1.988 | 2.062 | 2.031 | 1.846 | 1.920 | 1.824 | 1.935 | 1.937 | 1.933 | 1.988 |
| 2020 | 1.848 | 1.622 | 1.190 | 0.880 | 0.887 | 1.124 | 1.240 | 1.226 | 1.122 | 1.154 | 1.241 | 1.444 |
| 2021 | 1.575 | 1.788 | 1.853 | 1.861 | 2.024 | 2.121 | 2.127 | 2.068 | 2.201 | 2.523 | 2.391 | 2.251 |
| 2022 | 2.616 | 2.872 | 3.780 | 4.042 | 4.646 | 4.362 | 3.696 | 3.596 | 3.435 | 4.345 | 4.063 | 3.117 |
| 2023 | 3.267 | 2.832 | 2.747 | 2.593 | 2.346 | 2.432 | 2.671 | 3.117 | 3.325 | 3.114 | 2.905 | 2.632 |
| 2024 | 2.681 | 2.771 | 2.674 | |||||||||
| - = No Data Reported; -- = Not Applicable; NA = Not Available; W = Withheld to avoid disclosure of individual company data. |
| Release Date: 4/17/2024 |
| Next Release Date: 4/24/2024 |
Referring Pages: