|
Download Data (XLS File) |
|
||||||||
|
||||||||
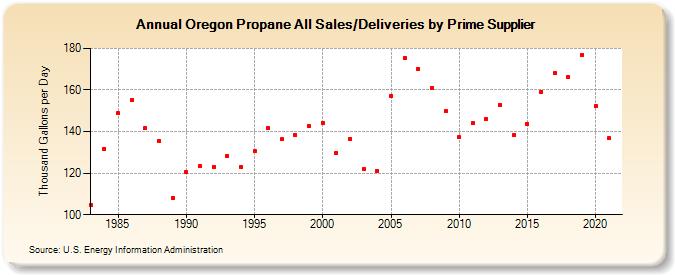
| Oregon Propane All Sales/Deliveries by Prime Supplier (Thousand Gallons per Day) | ||||||||
| Decade | Year-0 | Year-1 | Year-2 | Year-3 | Year-4 | Year-5 | Year-6 | Year-7 | Year-8 | Year-9 |
|---|---|---|---|---|---|---|---|---|---|---|
| 1980's | 104.6 | 131.8 | 148.7 | 155.4 | 141.6 | 135.5 | 108.1 | |||
| 1990's | 120.4 | 123.3 | 123.1 | 128.2 | 123.1 | 130.5 | 141.6 | 136.2 | 138.5 | 142.5 |
| 2000's | 144.3 | 129.7 | 136.6 | 122.1 | 121.2 | 157.1 | 175.5 | 170.2 | 160.9 | 150.0 |
| 2010's | 137.2 | 143.9 | 146.0 | 153.0 | 138.2 | 143.6 | 159.2 | 168.0 | 166.3 | 177.0 |
| 2020's | 152.4 |
| - = No Data Reported; -- = Not Applicable; NA = Not Available; W = Withheld to avoid disclosure of individual company data. |
| Release Date: 6/1/2022 |
| Next Release Date: TBD |