|
Download Data (XLS File) |
|
||||||||
|
||||||||
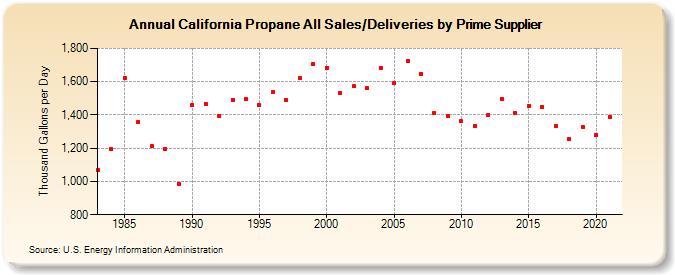
| California Propane All Sales/Deliveries by Prime Supplier (Thousand Gallons per Day) | ||||||||
| Decade | Year-0 | Year-1 | Year-2 | Year-3 | Year-4 | Year-5 | Year-6 | Year-7 | Year-8 | Year-9 |
|---|---|---|---|---|---|---|---|---|---|---|
| 1980's | 1,070.9 | 1,194.9 | 1,621.3 | 1,358.3 | 1,211.8 | 1,195.3 | 986.6 | |||
| 1990's | 1,458.6 | 1,468.1 | 1,393.9 | 1,489.9 | 1,494.3 | 1,457.9 | 1,535.5 | 1,490.4 | 1,622.3 | 1,704.1 |
| 2000's | 1,685.0 | 1,533.0 | 1,573.4 | 1,559.8 | 1,683.9 | 1,592.1 | 1,727.0 | 1,648.5 | 1,411.5 | 1,393.1 |
| 2010's | 1,361.2 | 1,330.9 | 1,400.1 | 1,497.3 | 1,411.9 | 1,454.6 | 1,449.5 | 1,335.6 | 1,253.6 | 1,328.4 |
| 2020's | 1,279.5 |
| - = No Data Reported; -- = Not Applicable; NA = Not Available; W = Withheld to avoid disclosure of individual company data. |
| Release Date: 6/1/2022 |
| Next Release Date: TBD |