|
Download Data (XLS File) |
|
||||||||
|
||||||||
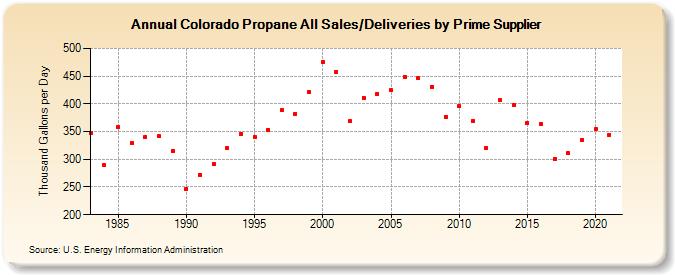
| Colorado Propane All Sales/Deliveries by Prime Supplier (Thousand Gallons per Day) | ||||||||
| Decade | Year-0 | Year-1 | Year-2 | Year-3 | Year-4 | Year-5 | Year-6 | Year-7 | Year-8 | Year-9 |
|---|---|---|---|---|---|---|---|---|---|---|
| 1980's | 346.8 | 288.8 | 359.0 | 329.7 | 340.9 | 341.1 | 315.2 | |||
| 1990's | 246.0 | 272.4 | 291.7 | 320.3 | 345.5 | 340.8 | 353.3 | 388.6 | 382.4 | 421.1 |
| 2000's | 475.8 | 457.9 | 368.4 | 411.1 | 418.2 | 424.2 | 449.0 | 445.8 | 431.0 | 376.8 |
| 2010's | 395.9 | 369.9 | 320.7 | 406.2 | 398.2 | 365.3 | 364.1 | 301.0 | 310.8 | 335.0 |
| 2020's | 353.9 |
| - = No Data Reported; -- = Not Applicable; NA = Not Available; W = Withheld to avoid disclosure of individual company data. |
| Release Date: 6/1/2022 |
| Next Release Date: TBD |