|
Download Data (XLS File) |
|
||||||||
|
||||||||
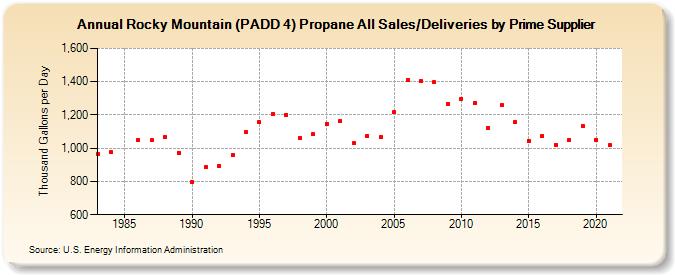
| Rocky Mountain (PADD 4) Propane All Sales/Deliveries by Prime Supplier (Thousand Gallons per Day) | ||||||||
| Decade | Year-0 | Year-1 | Year-2 | Year-3 | Year-4 | Year-5 | Year-6 | Year-7 | Year-8 | Year-9 |
|---|---|---|---|---|---|---|---|---|---|---|
| 1980's | 967.9 | 975.0 | W | 1,048.5 | 1,046.8 | 1,065.3 | 973.0 | |||
| 1990's | 793.8 | 885.3 | 891.9 | 957.6 | 1,095.1 | 1,157.3 | 1,206.3 | 1,201.8 | 1,060.4 | 1,082.3 |
| 2000's | 1,147.2 | 1,163.3 | 1,028.2 | 1,073.6 | 1,068.1 | 1,215.2 | 1,407.3 | 1,402.6 | 1,395.7 | 1,266.3 |
| 2010's | 1,297.3 | 1,274.6 | 1,123.5 | 1,260.0 | 1,155.1 | 1,045.5 | 1,076.1 | 1,021.4 | 1,047.6 | 1,132.7 |
| 2020's | 1,049.5 |
| - = No Data Reported; -- = Not Applicable; NA = Not Available; W = Withheld to avoid disclosure of individual company data. |
| Release Date: 6/1/2022 |
| Next Release Date: TBD |