|
Download Data (XLS File) |
|
||||||||
|
||||||||
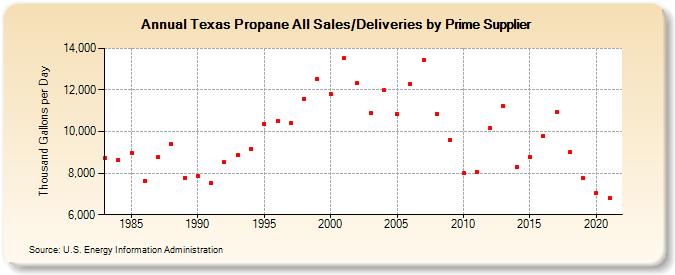
| Texas Propane All Sales/Deliveries by Prime Supplier (Thousand Gallons per Day) | ||||||||
| Decade | Year-0 | Year-1 | Year-2 | Year-3 | Year-4 | Year-5 | Year-6 | Year-7 | Year-8 | Year-9 |
|---|---|---|---|---|---|---|---|---|---|---|
| 1980's | 8,718.6 | 8,647.6 | 8,974.9 | 7,631.4 | 8,755.7 | 9,388.4 | 7,779.9 | |||
| 1990's | 7,871.4 | 7,535.9 | 8,512.2 | 8,869.1 | 9,167.7 | 10,381.7 | 10,497.7 | 10,413.4 | 11,584.2 | 12,513.6 |
| 2000's | 11,823.4 | 13,545.4 | 12,326.5 | 10,877.0 | 11,978.8 | 10,850.2 | 12,301.9 | 13,456.9 | 10,852.2 | 9,604.2 |
| 2010's | 7,993.3 | 8,076.0 | 10,157.9 | 11,217.6 | 8,288.9 | 8,764.4 | 9,788.2 | 10,937.0 | 9,003.8 | 7,760.8 |
| 2020's | 7,051.3 |
| - = No Data Reported; -- = Not Applicable; NA = Not Available; W = Withheld to avoid disclosure of individual company data. |
| Release Date: 6/1/2022 |
| Next Release Date: TBD |