|
Download Data (XLS File) |
|
||||||||
|
||||||||
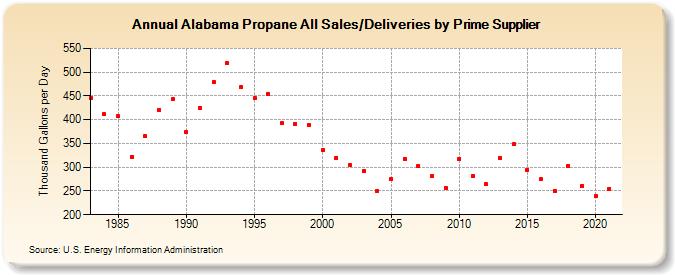
| Alabama Propane All Sales/Deliveries by Prime Supplier (Thousand Gallons per Day) | ||||||||
| Decade | Year-0 | Year-1 | Year-2 | Year-3 | Year-4 | Year-5 | Year-6 | Year-7 | Year-8 | Year-9 |
|---|---|---|---|---|---|---|---|---|---|---|
| 1980's | 446.1 | 411.1 | 407.5 | 322.2 | 365.1 | 420.6 | 443.0 | |||
| 1990's | 374.6 | 425.0 | 479.4 | 518.4 | 468.0 | 445.9 | 454.1 | 392.8 | 391.1 | 389.3 |
| 2000's | 336.5 | 320.3 | 304.2 | 292.0 | 249.7 | 275.2 | 317.8 | 302.9 | 281.2 | 256.2 |
| 2010's | 317.9 | 282.5 | 263.7 | 318.9 | 347.8 | 294.4 | 274.5 | 250.6 | 302.7 | 261.2 |
| 2020's | 238.5 |
| - = No Data Reported; -- = Not Applicable; NA = Not Available; W = Withheld to avoid disclosure of individual company data. |
| Release Date: 6/1/2022 |
| Next Release Date: TBD |