|
Download Data (XLS File) |
|
||||||||
|
||||||||
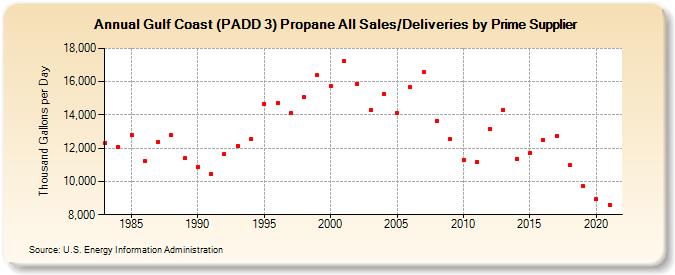
| Gulf Coast (PADD 3) Propane All Sales/Deliveries by Prime Supplier (Thousand Gallons per Day) | ||||||||
| Decade | Year-0 | Year-1 | Year-2 | Year-3 | Year-4 | Year-5 | Year-6 | Year-7 | Year-8 | Year-9 |
|---|---|---|---|---|---|---|---|---|---|---|
| 1980's | 12,310.2 | 12,074.1 | 12,817.7 | 11,236.0 | 12,390.8 | 12,770.8 | 11,387.9 | |||
| 1990's | 10,874.4 | 10,461.8 | 11,653.2 | 12,136.2 | 12,557.7 | 14,682.5 | 14,710.4 | 14,103.7 | 15,047.4 | 16,381.6 |
| 2000's | 15,738.9 | 17,265.0 | 15,876.8 | 14,279.7 | 15,279.1 | 14,090.2 | 15,673.7 | 16,577.9 | 13,656.5 | 12,534.9 |
| 2010's | 11,311.2 | 11,196.2 | 13,177.4 | 14,312.0 | 11,364.7 | 11,703.4 | 12,485.2 | 12,744.3 | 10,973.1 | 9,725.7 |
| 2020's | 8,925.2 |
| - = No Data Reported; -- = Not Applicable; NA = Not Available; W = Withheld to avoid disclosure of individual company data. |
| Release Date: 6/1/2022 |
| Next Release Date: TBD |