|
Download Data (XLS File) |
|
||||||||
|
||||||||
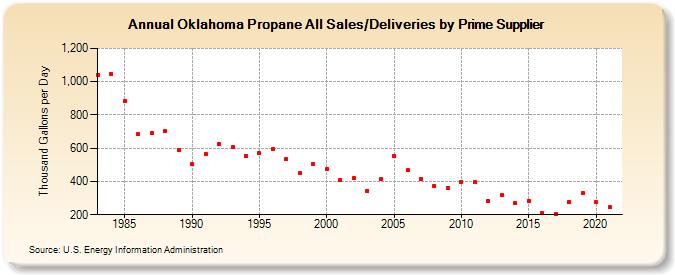
| Oklahoma Propane All Sales/Deliveries by Prime Supplier (Thousand Gallons per Day) | ||||||||
| Decade | Year-0 | Year-1 | Year-2 | Year-3 | Year-4 | Year-5 | Year-6 | Year-7 | Year-8 | Year-9 |
|---|---|---|---|---|---|---|---|---|---|---|
| 1980's | 1,042.3 | 1,046.0 | 883.8 | 684.6 | 690.3 | 702.9 | 589.9 | |||
| 1990's | 503.3 | 565.0 | 623.3 | 605.4 | 552.6 | 568.2 | 595.8 | 533.1 | 447.8 | 505.3 |
| 2000's | 473.0 | 407.0 | 418.2 | 344.3 | 414.5 | 552.1 | 467.7 | 413.3 | 373.1 | 362.6 |
| 2010's | 398.6 | 394.6 | 279.8 | 318.3 | 273.2 | 284.7 | 211.4 | 205.0 | 275.7 | 330.2 |
| 2020's | 274.2 |
| - = No Data Reported; -- = Not Applicable; NA = Not Available; W = Withheld to avoid disclosure of individual company data. |
| Release Date: 6/1/2022 |
| Next Release Date: TBD |