|
Download Data (XLS File) |
|
||||||||
|
||||||||
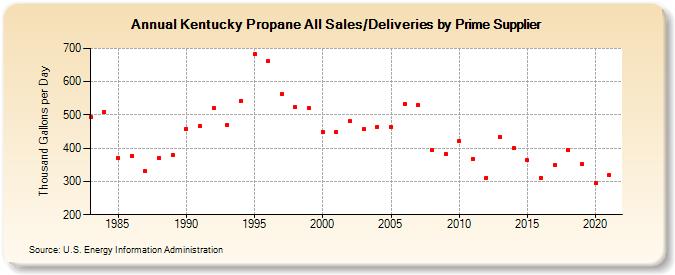
| Kentucky Propane All Sales/Deliveries by Prime Supplier (Thousand Gallons per Day) | ||||||||
| Decade | Year-0 | Year-1 | Year-2 | Year-3 | Year-4 | Year-5 | Year-6 | Year-7 | Year-8 | Year-9 |
|---|---|---|---|---|---|---|---|---|---|---|
| 1980's | 493.2 | 509.0 | 371.8 | 376.3 | 330.6 | 370.8 | 380.6 | |||
| 1990's | 457.7 | 466.2 | 519.4 | 470.2 | 543.0 | 681.9 | 660.8 | 564.0 | 522.5 | 519.9 |
| 2000's | 449.7 | 448.0 | 480.8 | 458.0 | 464.5 | 464.0 | 534.0 | 528.5 | 395.9 | 383.1 |
| 2010's | 421.2 | 368.7 | 311.8 | 434.9 | 400.6 | 363.2 | 311.3 | 348.4 | 393.5 | 352.3 |
| 2020's | 296.5 |
| - = No Data Reported; -- = Not Applicable; NA = Not Available; W = Withheld to avoid disclosure of individual company data. |
| Release Date: 6/1/2022 |
| Next Release Date: TBD |