|
Download Data (XLS File) |
|
||||||||
|
||||||||
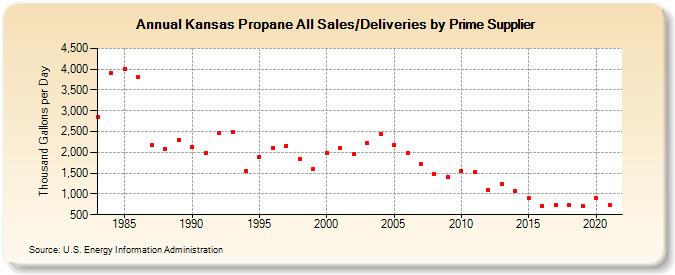
| Kansas Propane All Sales/Deliveries by Prime Supplier (Thousand Gallons per Day) | ||||||||
| Decade | Year-0 | Year-1 | Year-2 | Year-3 | Year-4 | Year-5 | Year-6 | Year-7 | Year-8 | Year-9 |
|---|---|---|---|---|---|---|---|---|---|---|
| 1980's | 2,857.7 | 3,897.6 | 4,013.2 | 3,802.9 | 2,171.2 | 2,087.7 | 2,302.4 | |||
| 1990's | 2,123.8 | 1,978.8 | 2,463.4 | 2,488.8 | 1,547.2 | 1,889.0 | 2,102.7 | 2,160.5 | 1,836.1 | 1,607.5 |
| 2000's | 1,982.4 | 2,100.6 | 1,953.3 | 2,215.7 | 2,433.1 | 2,186.6 | 1,974.2 | 1,713.1 | 1,481.9 | 1,412.7 |
| 2010's | 1,548.9 | 1,520.9 | 1,093.9 | 1,240.8 | 1,069.3 | 898.2 | 709.3 | 727.5 | 731.7 | 714.4 |
| 2020's | 898.6 |
| - = No Data Reported; -- = Not Applicable; NA = Not Available; W = Withheld to avoid disclosure of individual company data. |
| Release Date: 6/1/2022 |
| Next Release Date: TBD |