|
Download Data (XLS File) |
|
||||||||
|
||||||||
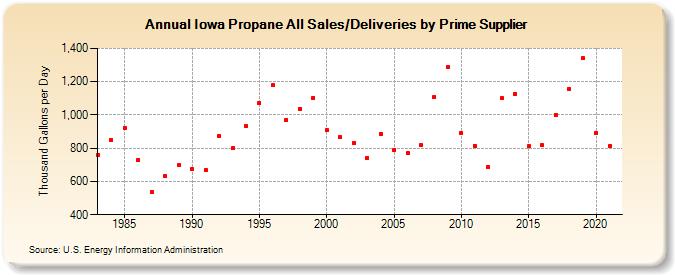
| Iowa Propane All Sales/Deliveries by Prime Supplier (Thousand Gallons per Day) | ||||||||
| Decade | Year-0 | Year-1 | Year-2 | Year-3 | Year-4 | Year-5 | Year-6 | Year-7 | Year-8 | Year-9 |
|---|---|---|---|---|---|---|---|---|---|---|
| 1980's | 759.5 | 848.7 | 923.9 | 731.8 | 535.9 | 632.5 | 697.3 | |||
| 1990's | 672.7 | 668.9 | 873.4 | 799.0 | 934.4 | 1,071.1 | 1,177.1 | 971.0 | 1,038.2 | 1,104.7 |
| 2000's | 906.6 | 868.4 | 833.7 | 741.3 | 886.4 | 791.2 | 769.2 | 817.0 | 1,108.5 | 1,285.9 |
| 2010's | 890.0 | 815.6 | 686.8 | 1,098.9 | 1,126.1 | 810.7 | 816.9 | 999.8 | 1,157.5 | 1,340.3 |
| 2020's | 893.0 |
| - = No Data Reported; -- = Not Applicable; NA = Not Available; W = Withheld to avoid disclosure of individual company data. |
| Release Date: 6/1/2022 |
| Next Release Date: TBD |