|
Download Data (XLS File) |
|
||||||||
|
||||||||
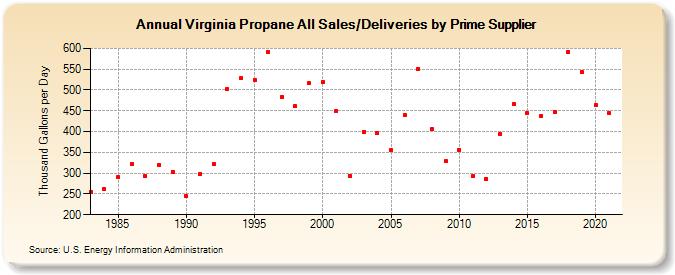
| Virginia Propane All Sales/Deliveries by Prime Supplier (Thousand Gallons per Day) | ||||||||
| Decade | Year-0 | Year-1 | Year-2 | Year-3 | Year-4 | Year-5 | Year-6 | Year-7 | Year-8 | Year-9 |
|---|---|---|---|---|---|---|---|---|---|---|
| 1980's | 255.4 | 261.1 | 290.9 | 322.9 | 292.5 | 318.4 | 303.8 | |||
| 1990's | 244.1 | 297.2 | 322.7 | 502.2 | 528.3 | 524.6 | 591.2 | 483.8 | 460.4 | 515.9 |
| 2000's | 519.0 | 450.5 | 294.0 | 400.0 | 395.5 | 355.1 | 440.3 | 551.3 | 405.0 | 328.9 |
| 2010's | 356.4 | 292.6 | 286.0 | 394.8 | 466.8 | 443.7 | 437.9 | 447.3 | 591.5 | 542.3 |
| 2020's | 463.7 |
| - = No Data Reported; -- = Not Applicable; NA = Not Available; W = Withheld to avoid disclosure of individual company data. |
| Release Date: 6/1/2022 |
| Next Release Date: TBD |