|
Download Data (XLS File) |
|
||||||||
|
||||||||
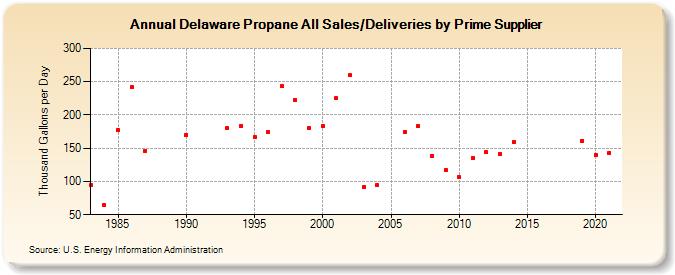
| Delaware Propane All Sales/Deliveries by Prime Supplier (Thousand Gallons per Day) | ||||||||
| Decade | Year-0 | Year-1 | Year-2 | Year-3 | Year-4 | Year-5 | Year-6 | Year-7 | Year-8 | Year-9 |
|---|---|---|---|---|---|---|---|---|---|---|
| 1980's | 94.0 | 64.5 | 177.6 | 241.4 | 145.9 | W | W | |||
| 1990's | 170.5 | W | W | 179.8 | 183.4 | 166.8 | 173.8 | 243.5 | 222.1 | 179.9 |
| 2000's | 183.9 | 225.4 | 259.5 | 91.8 | 94.5 | W | 174.8 | 183.1 | 138.3 | 117.5 |
| 2010's | 106.1 | 135.3 | 143.8 | 142.0 | 159.6 | W | W | W | W | 161.3 |
| 2020's | 139.6 |
| - = No Data Reported; -- = Not Applicable; NA = Not Available; W = Withheld to avoid disclosure of individual company data. |
| Release Date: 6/1/2022 |
| Next Release Date: TBD |