|
Download Data (XLS File) |
|
||||||||
|
||||||||
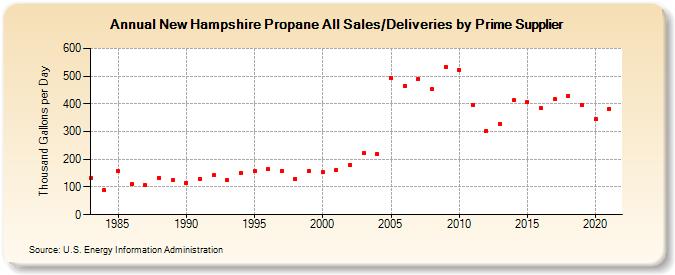
| New Hampshire Propane All Sales/Deliveries by Prime Supplier (Thousand Gallons per Day) | ||||||||
| Decade | Year-0 | Year-1 | Year-2 | Year-3 | Year-4 | Year-5 | Year-6 | Year-7 | Year-8 | Year-9 |
|---|---|---|---|---|---|---|---|---|---|---|
| 1980's | 133.2 | 88.9 | 158.5 | 110.0 | 106.2 | 133.9 | 123.9 | |||
| 1990's | 116.1 | 130.6 | 142.0 | 126.8 | 149.9 | 155.9 | 165.6 | 158.9 | 129.6 | 159.2 |
| 2000's | 152.5 | 161.7 | 179.9 | 222.2 | 218.3 | 493.6 | 465.2 | 490.7 | 451.8 | 534.4 |
| 2010's | 522.7 | 397.5 | 303.0 | 328.7 | 412.2 | 406.1 | 383.2 | 416.3 | 429.7 | 396.4 |
| 2020's | 344.5 |
| - = No Data Reported; -- = Not Applicable; NA = Not Available; W = Withheld to avoid disclosure of individual company data. |
| Release Date: 6/1/2022 |
| Next Release Date: TBD |