|
Download Data (XLS File) |
|
||||||||
|
||||||||
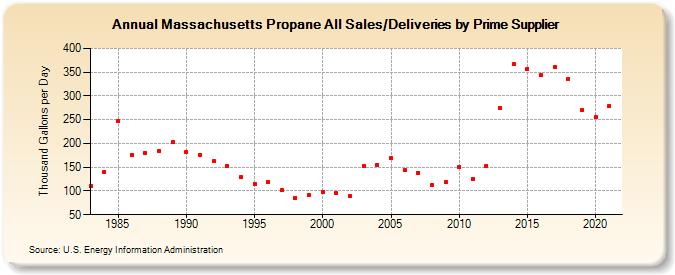
| Massachusetts Propane All Sales/Deliveries by Prime Supplier (Thousand Gallons per Day) | ||||||||
| Decade | Year-0 | Year-1 | Year-2 | Year-3 | Year-4 | Year-5 | Year-6 | Year-7 | Year-8 | Year-9 |
|---|---|---|---|---|---|---|---|---|---|---|
| 1980's | 110.4 | 140.4 | 247.2 | 176.5 | 180.0 | 184.3 | 203.0 | |||
| 1990's | 182.4 | 176.7 | 162.3 | 152.2 | 128.7 | 115.4 | 118.9 | 101.1 | 85.6 | 91.8 |
| 2000's | 98.1 | 95.5 | 89.9 | 152.9 | 154.7 | 169.3 | 143.5 | 138.4 | 113.0 | 118.8 |
| 2010's | 150.6 | 125.3 | 153.4 | 275.2 | 367.1 | 357.5 | 343.1 | 361.0 | 336.3 | 270.6 |
| 2020's | 254.9 |
| - = No Data Reported; -- = Not Applicable; NA = Not Available; W = Withheld to avoid disclosure of individual company data. |
| Release Date: 6/1/2022 |
| Next Release Date: TBD |