|
Download Data (XLS File) |
|
||||||||
|
||||||||
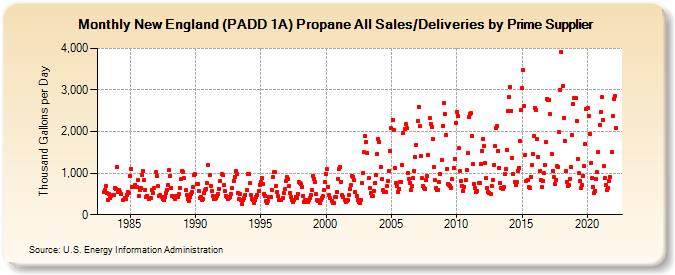
| New England (PADD 1A) Propane All Sales/Deliveries by Prime Supplier (Thousand Gallons per Day) | ||||||||
| Year | Jan | Feb | Mar | Apr | May | Jun | Jul | Aug | Sep | Oct | Nov | Dec |
|---|---|---|---|---|---|---|---|---|---|---|---|---|
| 1983 | 546.8 | 595.8 | 682.7 | 510.3 | 365.5 | 492.8 | 404.7 | 458.6 | 464.3 | 479.5 | 637.6 | 614.7 |
| 1984 | 1,143.5 | 556.5 | 584.3 | 539.6 | 508.1 | W | 363.7 | 407.1 | 374.7 | 480.5 | 553.4 | 514.2 |
| 1985 | 940.8 | 1,094.7 | 663.8 | 664.1 | 656.7 | 724.1 | 667.8 | 830.9 | 458.0 | 605.2 | 644.1 | 964.3 |
| 1986 | 1,055.0 | 830.4 | 606.3 | 419.5 | 460.1 | 367.7 | 395.2 | 412.0 | 605.4 | 531.3 | 633.6 | W |
| 1987 | 1,019.5 | 926.6 | 679.3 | 453.6 | 474.5 | 416.9 | 373.1 | 343.6 | 417.7 | 523.5 | 591.2 | 711.3 |
| 1988 | 1,071.6 | 940.6 | 652.6 | 458.2 | 420.5 | 388.4 | 438.4 | 424.6 | 435.2 | 487.2 | 643.2 | 858.8 |
| 1989 | 1,055.1 | 1,028.8 | 873.6 | 584.6 | 465.9 | 369.6 | 338.2 | 420.0 | 491.5 | 541.0 | 655.4 | 953.4 |
| 1990 | 970.0 | 747.6 | 739.0 | 567.2 | 404.6 | 437.2 | 358.9 | 375.6 | 520.4 | 604.5 | 612.7 | 753.4 |
| 1991 | 1,189.0 | 946.3 | 694.3 | 559.8 | 444.0 | 370.6 | 374.5 | 407.1 | 447.6 | 505.7 | 624.6 | 815.2 |
| 1992 | 975.7 | 944.7 | 708.4 | 566.2 | 461.7 | 420.8 | 379.9 | 390.4 | 421.5 | 494.4 | 636.5 | 816.7 |
| 1993 | 905.3 | 1,048.5 | 978.7 | 529.1 | 370.2 | 492.6 | 352.4 | 258.7 | 363.9 | 413.1 | 477.2 | 591.8 |
| 1994 | 983.2 | 979.0 | 758.6 | 462.5 | 368.7 | 359.8 | 280.8 | 349.7 | 432.6 | 466.8 | 570.0 | 725.7 |
| 1995 | 794.8 | 891.1 | 730.4 | 503.8 | 442.4 | 341.3 | 288.2 | 331.9 | 425.2 | 423.7 | 598.3 | 899.4 |
| 1996 | 1,026.8 | 1,024.7 | 690.7 | 542.9 | 442.3 | 357.0 | 349.3 | 353.8 | 407.7 | 511.4 | 608.6 | 811.6 |
| 1997 | 903.3 | 870.3 | 700.5 | 529.1 | 432.3 | 355.4 | 315.2 | 352.7 | 436.2 | 404.1 | 507.0 | 785.0 |
| 1998 | 762.0 | 746.5 | 676.1 | 456.3 | 315.1 | 355.4 | 295.1 | 310.3 | 364.9 | 403.1 | 466.3 | 583.3 |
| 1999 | 929.2 | 848.8 | 777.5 | 500.0 | 342.9 | 337.1 | 282.1 | 346.8 | 390.0 | 443.0 | 586.1 | 785.3 |
| 2000 | 986.0 | 1,087.8 | 664.0 | 468.9 | 393.5 | 338.8 | 284.7 | 291.4 | 424.4 | 429.4 | 556.8 | 869.5 |
| 2001 | 1,099.4 | 1,147.0 | 796.3 | 478.2 | 431.6 | 343.1 | 317.3 | 318.4 | 357.9 | 464.6 | 624.0 | 707.1 |
| 2002 | 932.7 | 919.0 | 834.5 | 541.6 | 452.8 | 358.6 | 315.1 | 277.6 | 343.1 | 760.3 | 1,013.1 | 1,512.0 |
| 2003 | 1,891.6 | 1,747.4 | 1,489.5 | 871.0 | 633.4 | 522.3 | 461.9 | 450.9 | 579.2 | 768.8 | 963.7 | 1,469.9 |
| 2004 | 1,824.3 | 1,747.4 | 1,148.2 | 853.9 | 587.3 | 549.3 | 554.7 | 545.5 | 683.8 | 812.8 | 1,056.9 | 1,542.0 |
| 2005 | 2,073.5 | 2,271.3 | 2,046.1 | 1,130.6 | 763.6 | 697.4 | 550.2 | 621.8 | 780.3 | 780.8 | 1,192.5 | 1,955.2 |
| 2006 | 2,072.7 | 2,173.3 | 2,083.6 | 1,008.6 | 861.1 | 773.5 | 601.2 | 684.2 | 872.4 | 1,041.1 | 1,383.2 | 1,677.9 |
| 2007 | 2,257.1 | 2,597.5 | 2,130.1 | 1,401.9 | 871.4 | 697.6 | 650.8 | 627.7 | 829.3 | 919.6 | 1,440.2 | 2,314.8 |
| 2008 | 2,176.2 | 2,120.3 | 1,821.0 | 1,141.6 | 827.3 | 643.1 | 597.9 | 603.7 | 789.6 | 990.1 | 1,324.0 | 2,141.1 |
| 2009 | 2,676.2 | 2,433.1 | 1,927.7 | 1,107.8 | 733.1 | 717.3 | 698.0 | 650.9 | 859.9 | 1,130.6 | 1,329.8 | 2,207.7 |
| 2010 | 2,470.8 | 2,364.4 | 1,592.7 | 1,054.7 | 800.6 | 699.4 | 575.6 | 672.6 | 828.2 | 1,069.9 | 1,475.3 | 2,361.0 |
| 2011 | 2,421.8 | 2,438.3 | 1,890.8 | 1,210.1 | 748.8 | 636.7 | 542.9 | 580.0 | 759.0 | 759.3 | 1,214.1 | 1,532.8 |
| 2012 | 1,829.4 | 1,652.8 | 1,239.9 | 879.9 | 647.3 | 544.4 | 527.6 | 500.8 | 698.2 | 832.0 | 1,199.7 | 1,644.6 |
| 2013 | 2,081.2 | 2,127.0 | 1,522.6 | 1,125.9 | 758.8 | 639.3 | 628.5 | 664.5 | 967.8 | 1,103.3 | 1,566.8 | 2,493.9 |
| 2014 | 2,824.3 | 3,077.6 | 2,489.7 | 1,367.5 | 978.6 | 785.8 | 716.0 | 793.7 | 1,060.5 | 1,132.9 | 1,778.1 | 2,509.6 |
| 2015 | 3,049.0 | 3,475.1 | 2,622.1 | 1,445.5 | 817.7 | 823.0 | 663.7 | 640.7 | 901.2 | 1,199.2 | 1,461.0 | 1,900.4 |
| 2016 | 2,566.8 | 2,522.6 | 1,811.8 | 1,392.4 | 1,046.4 | 843.3 | 657.7 | 810.3 | 995.2 | 1,183.8 | 1,758.1 | 2,792.2 |
| 2017 | 2,766.9 | 2,765.7 | 2,415.6 | 1,463.9 | 1,058.3 | 911.6 | 738.2 | 845.9 | 1,166.0 | 1,141.7 | 1,981.5 | 3,007.9 |
| 2018 | 3,912.7 | 3,091.7 | 2,332.3 | 1,781.4 | 1,042.0 | 798.2 | 690.5 | 711.9 | 864.3 | 1,143.1 | 1,905.9 | 2,658.5 |
| 2019 | 2,800.8 | 2,805.3 | 2,254.0 | 1,348.3 | 1,007.6 | 802.2 | 640.6 | 716.8 | 934.8 | 1,165.0 | 1,707.1 | 2,533.3 |
| 2020 | 2,578.4 | 2,382.2 | 1,943.9 | 1,244.8 | 880.9 | 667.5 | 513.5 | 566.2 | 847.9 | 1,021.7 | 1,511.3 | 2,152.2 |
| 2021 | 2,469.9 | 2,821.5 | 2,287.6 | 1,161.8 | 872.6 | 725.8 | 590.3 | 639.9 | 801.4 | 903.1 | 1,497.5 | 2,371.4 |
| 2022 | 2,780.2 | 2,843.6 | 2,088.5 | |||||||||
| - = No Data Reported; -- = Not Applicable; NA = Not Available; W = Withheld to avoid disclosure of individual company data. |
| Release Date: 5/19/2022 |
| Next Release Date: TBD |