|
Download Data (XLS File) |
|
||||||||
|
||||||||
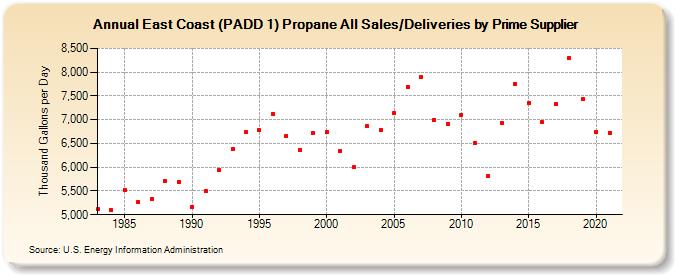
| East Coast (PADD 1) Propane All Sales/Deliveries by Prime Supplier (Thousand Gallons per Day) | ||||||||
| Decade | Year-0 | Year-1 | Year-2 | Year-3 | Year-4 | Year-5 | Year-6 | Year-7 | Year-8 | Year-9 |
|---|---|---|---|---|---|---|---|---|---|---|
| 1980's | 5,110.9 | 5,094.5 | 5,521.6 | 5,274.1 | 5,323.2 | 5,706.7 | 5,693.4 | |||
| 1990's | 5,170.9 | 5,494.7 | 5,933.9 | 6,378.4 | 6,733.2 | 6,775.9 | 7,128.6 | 6,666.1 | 6,359.6 | 6,709.5 |
| 2000's | 6,734.8 | 6,331.1 | 5,996.9 | 6,857.9 | 6,785.3 | 7,135.8 | 7,689.5 | 7,891.1 | 7,001.5 | 6,917.7 |
| 2010's | 7,104.1 | 6,512.9 | 5,811.4 | 6,939.9 | 7,761.1 | 7,352.1 | 6,947.9 | 7,327.4 | 8,299.6 | 7,428.5 |
| 2020's | 6,736.7 |
| - = No Data Reported; -- = Not Applicable; NA = Not Available; W = Withheld to avoid disclosure of individual company data. |
| Release Date: 6/1/2022 |
| Next Release Date: TBD |