|
Download Data (XLS File) |
|
||||||||
|
||||||||
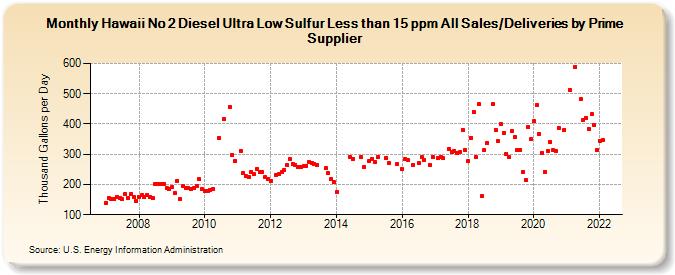
| Hawaii No 2 Diesel Ultra Low Sulfur Less than 15 ppm All Sales/Deliveries by Prime Supplier (Thousand Gallons per Day) | ||||||||
| Year | Jan | Feb | Mar | Apr | May | Jun | Jul | Aug | Sep | Oct | Nov | Dec |
|---|---|---|---|---|---|---|---|---|---|---|---|---|
| 2007 | 139.7 | 156.1 | 151.1 | 151.5 | 157.9 | 155.4 | 150.6 | 168.1 | 155.3 | 168.2 | 159.4 | 144.7 |
| 2008 | 158.8 | 163.6 | 158.4 | 165.9 | 158.9 | 154.1 | 200.4 | 202.4 | 202.1 | 203.2 | 188.0 | 184.7 |
| 2009 | 192.9 | 171.8 | 212.5 | 151.6 | 194.9 | 189.0 | 188.0 | 186.5 | 188.8 | 195.5 | 216.9 | 183.8 |
| 2010 | 178.4 | 179.0 | 181.9 | 185.6 | NA | 353.5 | NA | 415.4 | NA | 457.6 | 297.6 | 278.0 |
| 2011 | W | 311.2 | 238.6 | 227.1 | 223.4 | 240.7 | 233.4 | 252.4 | 240.4 | 241.3 | 223.4 | 219.0 |
| 2012 | 212.2 | W | 232.7 | 233.7 | 241.0 | 248.2 | 263.4 | 284.3 | 268.4 | 265.2 | 258.5 | 256.5 |
| 2013 | 260.1 | 262.6 | 275.5 | 271.3 | 267.8 | 263.8 | W | W | 253.6 | 237.2 | 216.6 | 206.9 |
| 2014 | 174.6 | NA | NA | W | W | 290.4 | 284.1 | W | W | 291.2 | 259.2 | W |
| 2015 | 278.3 | 284.3 | 275.0 | 290.9 | W | W | 288.2 | 271.7 | W | W | 266.1 | W |
| 2016 | 250.6 | 283.1 | 281.7 | W | 265.4 | W | 270.4 | 289.8 | 279.8 | W | 264.7 | 292.0 |
| 2017 | W | 286.5 | 290.9 | 286.6 | W | 316.7 | 306.6 | 311.0 | 302.7 | 307.5 | 381.1 | 313.1 |
| 2018 | 276.0 | 354.6 | 440.4 | 290.0 | 465.1 | 160.7 | 314.7 | 337.2 | W | 464.8 | 381.2 | 342.5 |
| 2019 | 400.2 | 371.6 | 301.4 | 290.9 | 376.0 | 357.9 | 312.8 | 315.5 | 242.6 | 214.1 | 390.5 | 349.3 |
| 2020 | 408.4 | 462.8 | 366.6 | 303.4 | 242.5 | 310.9 | 340.6 | 313.0 | 309.8 | 386.8 | NA | 380.8 |
| 2021 | W | 513.3 | W | 589.5 | W | 482.1 | 414.0 | 419.9 | 384.3 | 431.5 | 395.4 | 313.4 |
| 2022 | 344.0 | 346.3 | NA | |||||||||
| - = No Data Reported; -- = Not Applicable; NA = Not Available; W = Withheld to avoid disclosure of individual company data. |
| Release Date: 5/19/2022 |
| Next Release Date: TBD |