|
Download Data (XLS File) |
|
||||||||
|
||||||||
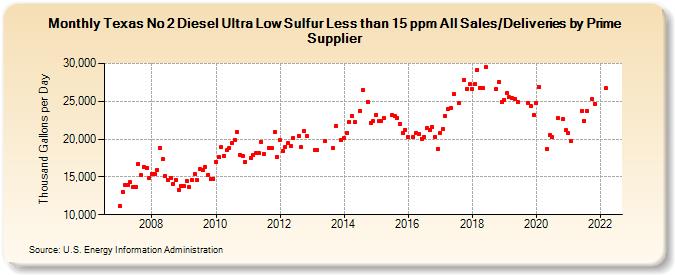
| Texas No 2 Diesel Ultra Low Sulfur Less than 15 ppm All Sales/Deliveries by Prime Supplier (Thousand Gallons per Day) | ||||||||
| Year | Jan | Feb | Mar | Apr | May | Jun | Jul | Aug | Sep | Oct | Nov | Dec |
|---|---|---|---|---|---|---|---|---|---|---|---|---|
| 2007 | 11,144.7 | 13,024.9 | 13,963.8 | 13,989.4 | 14,267.5 | 13,628.5 | 13,672.9 | 16,720.1 | 15,231.3 | 16,357.1 | 16,145.7 | 14,880.1 |
| 2008 | 15,380.7 | 15,374.4 | 15,970.6 | 18,853.1 | 17,321.0 | 15,115.9 | 14,649.1 | 14,862.6 | 14,127.8 | 14,597.9 | 13,310.8 | 13,778.3 |
| 2009 | 13,792.5 | 14,474.4 | 13,660.6 | 14,565.7 | 15,441.6 | 14,571.0 | 16,052.1 | 15,853.0 | 16,304.7 | 15,310.2 | 14,693.3 | 14,753.1 |
| 2010 | 17,015.5 | 17,654.1 | 18,890.2 | 17,799.7 | 18,516.7 | 18,821.3 | 19,498.3 | 19,896.4 | 20,969.4 | 17,961.3 | 17,772.8 | 17,032.1 |
| 2011 | W | 17,461.5 | 17,869.4 | 18,095.8 | 18,121.6 | 19,628.2 | 18,038.3 | W | 18,835.2 | 18,778.0 | 20,947.0 | 17,675.4 |
| 2012 | 19,863.5 | 18,390.4 | 18,987.3 | 19,454.0 | 19,113.0 | 20,177.1 | W | 20,427.3 | 18,892.6 | 21,062.4 | 20,449.7 | W |
| 2013 | W | 18,584.4 | 18,561.8 | W | W | 19,764.1 | W | W | 18,817.4 | 21,740.9 | W | 19,826.0 |
| 2014 | 20,147.3 | 20,865.6 | 22,288.4 | 23,113.8 | 22,216.8 | W | 23,741.8 | 26,498.7 | W | 24,966.3 | 22,147.3 | 22,377.7 |
| 2015 | 23,249.7 | 22,377.9 | 22,380.3 | 22,808.8 | W | W | 23,135.2 | 22,996.9 | 22,755.2 | 22,055.5 | 20,810.5 | 21,243.4 |
| 2016 | 20,335.1 | W | 20,308.6 | 20,792.8 | 20,670.0 | 20,054.3 | 20,332.5 | 21,465.8 | 21,172.8 | 21,598.6 | 20,285.5 | 18,718.3 |
| 2017 | 20,866.7 | 21,270.8 | 23,064.8 | 23,955.6 | 24,134.9 | 25,934.2 | W | 24,788.0 | W | 27,836.1 | 26,676.3 | 27,238.3 |
| 2018 | 26,672.3 | 27,223.4 | 29,193.4 | 26,773.1 | 26,815.7 | 29,497.9 | W | W | W | 26,589.5 | 27,609.5 | 24,868.0 |
| 2019 | 25,212.3 | 26,038.0 | 25,563.7 | 25,381.6 | 25,285.7 | 24,960.6 | W | W | W | 24,729.3 | 24,317.0 | 23,198.3 |
| 2020 | 24,784.2 | 26,872.2 | W | W | 18,720.1 | 20,478.5 | 20,242.6 | W | 22,752.2 | W | 22,610.5 | 21,178.1 |
| 2021 | 20,834.4 | 19,696.3 | W | W | W | 23,750.4 | 22,411.3 | 23,774.9 | W | 25,298.9 | 24,700.5 | W |
| 2022 | W | W | 26,699.4 | |||||||||
| - = No Data Reported; -- = Not Applicable; NA = Not Available; W = Withheld to avoid disclosure of individual company data. |
| Release Date: 5/19/2022 |
| Next Release Date: TBD |