|
Download Data (XLS File) |
|
||||||||
|
||||||||
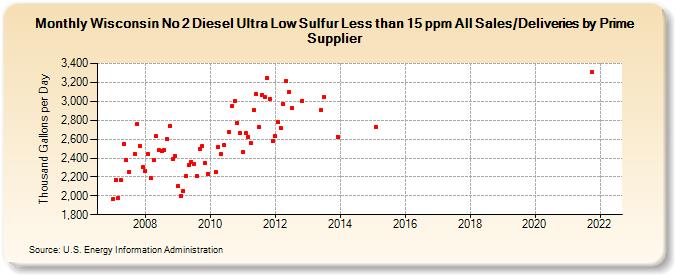
| Wisconsin No 2 Diesel Ultra Low Sulfur Less than 15 ppm All Sales/Deliveries by Prime Supplier (Thousand Gallons per Day) | ||||||||
| Year | Jan | Feb | Mar | Apr | May | Jun | Jul | Aug | Sep | Oct | Nov | Dec |
|---|---|---|---|---|---|---|---|---|---|---|---|---|
| 2007 | 1,962.8 | 2,172.2 | 1,976.8 | 2,165.3 | 2,546.3 | 2,377.9 | 2,253.8 | W | 2,447.6 | 2,761.4 | 2,527.9 | 2,301.5 |
| 2008 | 2,266.1 | 2,440.3 | 2,185.0 | 2,378.5 | 2,629.3 | 2,481.2 | 2,472.4 | 2,481.1 | 2,600.7 | 2,743.5 | 2,386.2 | 2,419.2 |
| 2009 | 2,103.8 | 2,001.4 | 2,052.8 | 2,206.6 | 2,327.5 | 2,360.1 | 2,339.1 | 2,205.4 | 2,500.2 | 2,527.4 | 2,352.1 | 2,230.9 |
| 2010 | W | W | 2,246.7 | 2,515.9 | 2,441.6 | 2,539.1 | W | 2,673.1 | 2,952.2 | 3,003.0 | 2,767.8 | 2,663.4 |
| 2011 | 2,463.2 | 2,660.1 | 2,624.9 | 2,556.2 | 2,908.0 | 3,080.0 | 2,725.3 | 3,071.8 | 3,041.8 | 3,249.4 | 3,024.7 | 2,579.8 |
| 2012 | 2,630.6 | 2,775.8 | 2,721.8 | 2,970.5 | 3,216.4 | 3,094.0 | 2,931.3 | W | W | W | 3,006.2 | W |
| 2013 | W | W | W | W | W | 2,909.8 | 3,048.6 | W | W | W | W | 2,626.0 |
| 2014 | W | W | W | W | W | W | W | W | W | W | W | W |
| 2015 | W | 2,729.3 | W | W | W | W | W | W | W | W | W | W |
| 2016 | W | W | W | W | W | W | W | W | W | W | W | W |
| 2017 | W | W | W | W | W | W | W | W | W | W | W | W |
| 2018 | W | W | W | W | W | W | W | W | W | W | W | W |
| 2019 | W | W | W | W | W | W | W | W | W | W | W | W |
| 2020 | W | W | W | W | W | W | W | W | W | W | W | W |
| 2021 | W | W | W | W | W | W | W | W | W | 3,306.5 | W | W |
| 2022 | W | W | W | |||||||||
| - = No Data Reported; -- = Not Applicable; NA = Not Available; W = Withheld to avoid disclosure of individual company data. |
| Release Date: 5/19/2022 |
| Next Release Date: TBD |