|
Download Data (XLS File) |
|
||||||||
|
||||||||
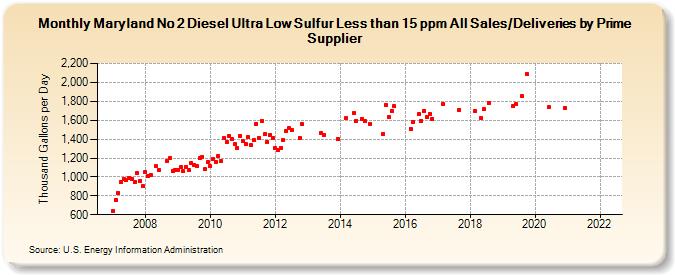
| Maryland No 2 Diesel Ultra Low Sulfur Less than 15 ppm All Sales/Deliveries by Prime Supplier (Thousand Gallons per Day) | ||||||||
| Year | Jan | Feb | Mar | Apr | May | Jun | Jul | Aug | Sep | Oct | Nov | Dec |
|---|---|---|---|---|---|---|---|---|---|---|---|---|
| 2007 | 636.1 | 754.8 | 832.2 | 949.9 | 977.6 | 963.5 | 991.8 | 982.6 | 951.1 | 1,036.6 | 959.5 | 899.7 |
| 2008 | 1,051.0 | 1,014.7 | 1,020.8 | W | 1,111.8 | 1,074.6 | W | W | 1,165.4 | 1,197.0 | 1,062.6 | 1,072.7 |
| 2009 | 1,077.8 | 1,100.5 | 1,057.7 | 1,107.9 | 1,077.6 | 1,145.4 | 1,131.0 | 1,115.5 | 1,198.0 | 1,210.6 | 1,078.7 | 1,154.4 |
| 2010 | 1,111.9 | 1,185.8 | 1,160.6 | 1,220.7 | 1,170.3 | 1,414.5 | 1,367.7 | 1,433.8 | 1,396.9 | 1,345.2 | 1,310.9 | 1,433.9 |
| 2011 | 1,379.6 | 1,348.1 | 1,423.6 | 1,338.1 | 1,389.4 | 1,562.8 | 1,410.6 | 1,596.6 | 1,450.0 | 1,374.3 | 1,444.5 | 1,415.9 |
| 2012 | 1,301.0 | 1,288.6 | 1,306.8 | 1,389.3 | 1,484.6 | 1,513.1 | 1,496.7 | W | W | 1,416.3 | 1,559.2 | W |
| 2013 | W | W | W | W | W | 1,464.6 | 1,442.2 | W | W | W | W | 1,401.0 |
| 2014 | W | W | 1,620.0 | W | W | 1,676.8 | 1,596.1 | W | 1,617.2 | 1,592.7 | W | 1,562.7 |
| 2015 | W | W | W | W | 1,458.4 | 1,762.1 | 1,637.5 | 1,698.6 | 1,746.5 | W | W | W |
| 2016 | W | W | 1,512.0 | 1,581.3 | W | 1,666.9 | 1,595.3 | 1,701.9 | 1,633.1 | 1,666.5 | 1,614.6 | W |
| 2017 | W | W | 1,769.7 | W | W | W | W | W | 1,709.1 | W | W | W |
| 2018 | W | W | 1,695.5 | W | 1,621.6 | 1,714.5 | W | 1,784.4 | W | W | W | W |
| 2019 | W | W | W | W | 1,745.9 | 1,766.9 | W | 1,853.4 | W | 2,088.1 | W | W |
| 2020 | W | W | W | W | W | 1,736.8 | W | W | W | W | W | 1,733.9 |
| 2021 | W | W | W | W | W | W | W | W | W | W | W | W |
| 2022 | W | W | W | |||||||||
| - = No Data Reported; -- = Not Applicable; NA = Not Available; W = Withheld to avoid disclosure of individual company data. |
| Release Date: 5/19/2022 |
| Next Release Date: TBD |