|
Download Data (XLS File) |
|
||||||||
|
||||||||
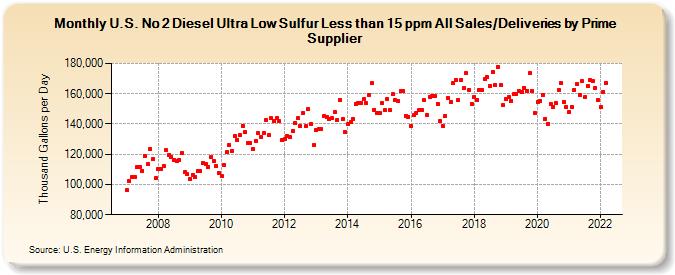
| U.S. No 2 Diesel Ultra Low Sulfur Less than 15 ppm All Sales/Deliveries by Prime Supplier (Thousand Gallons per Day) | ||||||||
| Year | Jan | Feb | Mar | Apr | May | Jun | Jul | Aug | Sep | Oct | Nov | Dec |
|---|---|---|---|---|---|---|---|---|---|---|---|---|
| 2007 | 96,317.4 | 102,020.6 | 104,975.7 | 104,850.9 | 111,277.9 | 111,737.3 | 109,233.1 | 118,807.2 | 113,265.4 | 123,350.6 | 116,570.9 | 104,169.3 |
| 2008 | 110,184.3 | 110,534.1 | 112,136.0 | 122,556.6 | 119,772.0 | 118,174.3 | 116,470.3 | 115,415.5 | 116,407.4 | 120,737.6 | 108,040.2 | 106,698.5 |
| 2009 | 103,450.6 | 106,471.7 | 105,117.4 | 108,885.0 | 108,601.8 | 114,218.4 | 113,231.2 | 111,774.0 | 117,933.1 | 115,589.0 | 111,912.9 | 107,843.7 |
| 2010 | 105,471.1 | 112,883.4 | 121,283.6 | 125,941.5 | 122,254.6 | 132,126.9 | 129,608.5 | 132,397.9 | 138,713.0 | 134,513.9 | 127,540.6 | 127,220.3 |
| 2011 | 123,555.5 | 128,647.9 | 133,797.1 | 131,280.0 | 133,805.0 | 142,477.3 | 132,396.1 | 143,650.0 | 141,841.5 | 143,625.2 | 141,721.7 | 129,439.7 |
| 2012 | 130,084.9 | 131,923.9 | 131,200.3 | 135,159.7 | 140,709.6 | 143,683.5 | 138,460.4 | 147,094.5 | 138,334.3 | 149,728.3 | 139,709.6 | 125,946.5 |
| 2013 | 136,025.1 | 136,438.6 | 136,636.4 | 145,179.5 | 144,703.3 | 143,116.8 | 143,842.9 | 147,654.9 | 142,675.5 | 156,129.6 | 143,026.4 | 134,636.2 |
| 2014 | 139,727.7 | 141,208.9 | 143,404.8 | 153,535.9 | 153,763.8 | 153,821.8 | 156,480.7 | 153,546.2 | 159,334.4 | 166,768.7 | 149,446.0 | 147,221.5 |
| 2015 | 147,074.2 | 153,584.9 | 148,915.9 | 156,546.4 | 148,925.1 | 159,620.6 | 155,989.3 | 155,456.7 | 161,735.9 | 161,558.0 | 145,456.2 | 144,816.8 |
| 2016 | 138,599.2 | 145,869.3 | 147,493.7 | 149,035.2 | 149,163.9 | 155,752.1 | 146,221.2 | 158,139.0 | 158,424.0 | 158,605.8 | 153,408.8 | 141,929.9 |
| 2017 | 138,925.6 | 145,438.4 | 157,322.9 | 154,272.5 | 167,191.5 | 169,199.3 | 155,721.3 | 168,992.7 | 163,815.0 | 173,489.1 | 162,482.8 | 153,131.5 |
| 2018 | 157,572.5 | 155,830.2 | 162,300.9 | 162,466.9 | 169,585.4 | 170,774.4 | 165,110.5 | 174,410.6 | 165,629.4 | 177,857.0 | 165,468.1 | 152,221.5 |
| 2019 | 156,808.4 | 157,685.2 | 155,374.1 | 159,548.4 | 159,926.0 | 161,744.1 | 161,163.8 | 164,109.3 | 161,957.9 | 173,508.6 | 161,567.8 | 147,349.1 |
| 2020 | 154,532.0 | 155,496.3 | 159,238.4 | 143,468.4 | 140,313.3 | 153,359.8 | 151,288.5 | 153,835.4 | 162,487.8 | 167,042.9 | 154,613.4 | 151,070.4 |
| 2021 | 148,053.5 | 151,210.6 | 162,730.3 | 166,363.3 | 159,392.9 | 168,111.9 | 157,635.9 | 165,117.5 | 168,939.7 | 168,127.8 | 164,111.8 | 155,903.4 |
| 2022 | 151,088.1 | 161,120.9 | 167,250.3 | |||||||||
| - = No Data Reported; -- = Not Applicable; NA = Not Available; W = Withheld to avoid disclosure of individual company data. |
| Release Date: 5/19/2022 |
| Next Release Date: TBD |