|
Download Data (XLS File) |
|
||||||||
|
||||||||
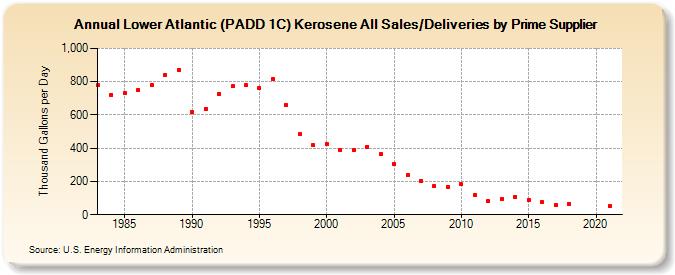
| Lower Atlantic (PADD 1C) Kerosene All Sales/Deliveries by Prime Supplier (Thousand Gallons per Day) | ||||||||
| Decade | Year-0 | Year-1 | Year-2 | Year-3 | Year-4 | Year-5 | Year-6 | Year-7 | Year-8 | Year-9 |
|---|---|---|---|---|---|---|---|---|---|---|
| 1980's | 779.4 | 722.2 | 732.1 | 752.5 | 782.0 | 841.6 | 869.9 | |||
| 1990's | 615.2 | 638.2 | 727.0 | 771.0 | 777.4 | 760.5 | 816.9 | 659.3 | 483.6 | 417.2 |
| 2000's | 424.4 | 389.4 | 390.4 | 409.6 | 362.8 | 303.6 | 236.9 | 204.0 | 169.9 | 169.0 |
| 2010's | 182.1 | 121.1 | 80.9 | 96.8 | 108.6 | 91.4 | 75.9 | 58.0 | 67.3 | W |
| 2020's | W |
| - = No Data Reported; -- = Not Applicable; NA = Not Available; W = Withheld to avoid disclosure of individual company data. |
| Release Date: 6/1/2022 |
| Next Release Date: TBD |