|
Download Data (XLS File) |
|
||||||||
|
||||||||
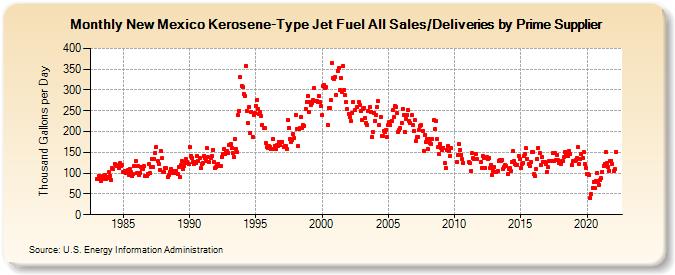
| New Mexico Kerosene-Type Jet Fuel All Sales/Deliveries by Prime Supplier (Thousand Gallons per Day) | ||||||||
| Year | Jan | Feb | Mar | Apr | May | Jun | Jul | Aug | Sep | Oct | Nov | Dec |
|---|---|---|---|---|---|---|---|---|---|---|---|---|
| 1983 | 85.8 | 86.6 | 93.5 | 90.2 | 81.0 | 86.0 | 94.3 | 95.0 | 85.5 | 88.5 | 89.7 | 101.9 |
| 1984 | 92.8 | 83.3 | 111.3 | 109.6 | 123.0 | 120.3 | 116.3 | 117.7 | 112.9 | 123.5 | 116.7 | 120.7 |
| 1985 | 101.7 | 104.3 | 100.0 | 101.1 | 107.1 | 95.7 | 109.4 | 101.9 | 92.5 | 96.8 | 117.9 | 129.7 |
| 1986 | 99.2 | 116.7 | 96.0 | 100.3 | 115.4 | 110.7 | 111.0 | 116.1 | 93.0 | 93.9 | 98.7 | 121.8 |
| 1987 | 99.4 | 114.7 | 134.9 | 113.9 | 134.6 | 149.3 | 162.4 | 128.1 | 121.1 | 108.5 | 153.7 | 135.3 |
| 1988 | 103.5 | 102.7 | 112.7 | 111.4 | 90.1 | 96.5 | 102.8 | 109.6 | 100.4 | 105.5 | 103.4 | 100.7 |
| 1989 | 106.3 | 97.4 | 114.9 | 90.2 | 119.1 | 129.7 | 110.7 | 116.0 | 123.9 | 133.4 | 126.3 | 121.9 |
| 1990 | 162.6 | 140.7 | 137.0 | 127.5 | 121.3 | 127.6 | 125.0 | 141.2 | 130.2 | 135.3 | 112.1 | 122.1 |
| 1991 | 125.4 | 141.6 | 137.3 | 130.3 | 159.3 | 137.7 | 125.6 | 135.3 | 140.8 | 156.8 | 126.6 | 112.9 |
| 1992 | 114.1 | 119.1 | 123.1 | 118.1 | 118.1 | 139.8 | 146.3 | 158.4 | 146.5 | 153.6 | 153.7 | 148.5 |
| 1993 | 168.4 | 170.8 | 161.4 | 148.2 | 138.3 | 181.9 | 157.7 | 149.9 | 239.0 | 250.5 | 331.2 | 309.8 |
| 1994 | 308.1 | 291.3 | 286.1 | 358.0 | 250.3 | 219.7 | 258.9 | 196.6 | 246.6 | 187.7 | 240.5 | 244.2 |
| 1995 | 262.1 | 277.0 | 254.6 | 242.1 | 246.0 | 236.9 | 216.2 | 208.7 | 207.6 | 172.6 | 161.9 | 161.2 |
| 1996 | 164.9 | 162.8 | 158.5 | 157.5 | 182.3 | 166.0 | 157.1 | 166.7 | 166.4 | 174.5 | 166.7 | 174.2 |
| 1997 | 174.5 | 163.1 | 166.3 | 164.3 | 158.9 | 228.2 | 209.5 | 181.9 | 175.6 | 180.2 | 193.3 | 184.5 |
| 1998 | 240.5 | 206.5 | 165.0 | 205.4 | 208.5 | 235.6 | 208.6 | 216.1 | 213.6 | 254.3 | 271.8 | 284.9 |
| 1999 | 247.0 | 269.9 | 263.7 | 268.2 | 276.4 | 304.5 | 273.9 | 274.4 | 270.9 | 285.0 | 270.5 | 260.3 |
| 2000 | 238.9 | 310.6 | 311.9 | 305.2 | 306.5 | 216.9 | 256.2 | 257.2 | 276.2 | 365.1 | 329.3 | 326.6 |
| 2001 | 331.7 | 288.2 | 346.3 | 352.8 | 299.9 | 329.3 | 295.5 | 357.8 | 301.1 | 286.8 | 270.6 | 253.5 |
| 2002 | 242.9 | 236.0 | 225.1 | 243.6 | 270.8 | W | 251.2 | W | 258.1 | 270.4 | 263.6 | 249.2 |
| 2003 | 228.2 | 254.5 | 255.5 | 233.5 | 221.3 | 216.1 | 250.1 | 258.6 | 245.9 | 186.3 | 198.8 | 245.4 |
| 2004 | 226.5 | 241.0 | 259.5 | 272.7 | 215.5 | 235.9 | 188.8 | 189.2 | 202.2 | 198.9 | 204.6 | 188.0 |
| 2005 | 216.8 | 221.8 | 215.5 | 226.0 | 250.8 | 234.0 | 262.5 | 259.8 | 245.0 | 199.9 | 204.1 | 208.9 |
| 2006 | 221.3 | 254.4 | 240.8 | 199.6 | 230.5 | 239.8 | 250.9 | 226.3 | 220.5 | 239.6 | 216.6 | 201.7 |
| 2007 | 227.0 | 177.6 | 187.4 | 186.3 | 204.9 | 214.3 | 215.4 | 202.2 | 153.4 | 192.5 | 175.3 | 181.3 |
| 2008 | 157.3 | 181.3 | 171.4 | 170.4 | 181.5 | 227.3 | 205.5 | 225.6 | 182.0 | 162.1 | 146.4 | 170.6 |
| 2009 | 159.5 | 154.5 | 161.1 | 124.1 | 112.3 | 156.1 | 166.4 | 153.5 | 141.4 | 159.3 | W | W |
| 2010 | W | W | 126.3 | 143.0 | 170.6 | 156.8 | 144.4 | 133.1 | 125.2 | W | W | W |
| 2011 | W | 126.0 | 123.3 | 105.8 | 147.8 | 137.1 | 133.5 | 146.6 | 134.8 | W | W | W |
| 2012 | 126.8 | 113.0 | 141.0 | 136.5 | 112.0 | 137.6 | 133.4 | 136.3 | 112.9 | 120.7 | 96.6 | 106.0 |
| 2013 | 115.0 | 103.5 | 102.1 | 106.2 | 130.3 | 131.1 | 129.8 | 131.1 | 110.3 | 114.9 | 119.3 | 117.6 |
| 2014 | 97.0 | 110.6 | 111.7 | 106.0 | 127.7 | 152.1 | 128.8 | 122.0 | 118.9 | 120.2 | 140.9 | 134.8 |
| 2015 | 112.6 | 123.1 | 124.6 | 142.1 | 146.8 | 159.8 | 134.2 | 122.5 | 116.8 | 127.2 | 150.3 | 150.7 |
| 2016 | 97.8 | 93.7 | 109.2 | 134.8 | 161.4 | 147.3 | 119.9 | 138.6 | 127.7 | 126.9 | 126.5 | 122.6 |
| 2017 | 103.6 | 113.8 | 130.1 | 128.3 | 129.5 | 148.3 | 128.5 | 148.0 | 130.5 | 143.1 | 130.4 | 124.0 |
| 2018 | 122.0 | 128.8 | 128.8 | 137.7 | 150.5 | 143.5 | 150.1 | 140.2 | 153.5 | 145.5 | 120.2 | 128.1 |
| 2019 | 129.5 | 129.2 | 130.7 | 136.2 | 162.0 | 122.9 | 134.1 | 145.7 | 136.2 | 149.8 | 121.8 | 113.0 |
| 2020 | 98.6 | 98.6 | 95.1 | 40.7 | 49.3 | 65.4 | 79.0 | 63.5 | 82.2 | 100.7 | 79.5 | 71.5 |
| 2021 | 84.1 | 87.2 | 103.5 | 118.1 | 122.3 | 150.2 | 124.4 | 114.6 | 106.3 | 130.3 | 129.8 | 122.6 |
| 2022 | 105.4 | 109.2 | 150.0 | |||||||||
| - = No Data Reported; -- = Not Applicable; NA = Not Available; W = Withheld to avoid disclosure of individual company data. |
| Release Date: 5/19/2022 |
| Next Release Date: TBD |