|
Download Data (XLS File) |
|
||||||||
|
||||||||
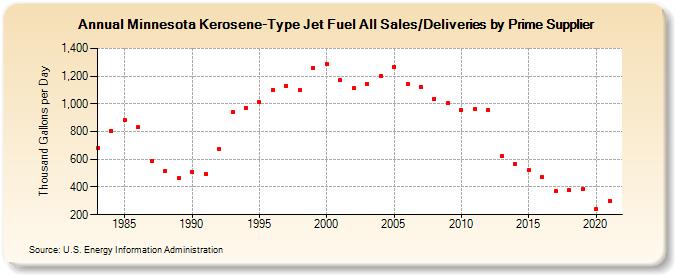
| Minnesota Kerosene-Type Jet Fuel All Sales/Deliveries by Prime Supplier (Thousand Gallons per Day) | ||||||||
| Decade | Year-0 | Year-1 | Year-2 | Year-3 | Year-4 | Year-5 | Year-6 | Year-7 | Year-8 | Year-9 |
|---|---|---|---|---|---|---|---|---|---|---|
| 1980's | 680.2 | 803.9 | 882.5 | 830.5 | 587.2 | 517.7 | 462.9 | |||
| 1990's | 510.3 | 494.7 | 672.1 | 940.7 | 971.8 | 1,012.8 | 1,103.3 | 1,132.0 | 1,101.2 | 1,257.6 |
| 2000's | 1,285.9 | 1,170.3 | 1,112.6 | 1,143.4 | 1,200.9 | 1,268.8 | 1,142.5 | 1,121.9 | 1,035.0 | 1,003.2 |
| 2010's | 955.0 | 963.1 | 956.0 | 626.6 | 568.1 | 521.8 | 473.8 | 371.9 | 375.1 | 382.3 |
| 2020's | 237.9 |
| - = No Data Reported; -- = Not Applicable; NA = Not Available; W = Withheld to avoid disclosure of individual company data. |
| Release Date: 6/1/2022 |
| Next Release Date: TBD |