|
Download Data (XLS File) |
|
||||||||
|
||||||||
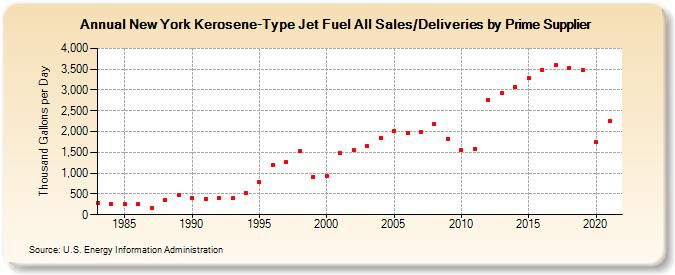
| New York Kerosene-Type Jet Fuel All Sales/Deliveries by Prime Supplier (Thousand Gallons per Day) | ||||||||
| Decade | Year-0 | Year-1 | Year-2 | Year-3 | Year-4 | Year-5 | Year-6 | Year-7 | Year-8 | Year-9 |
|---|---|---|---|---|---|---|---|---|---|---|
| 1980's | 278.3 | 249.0 | 258.1 | 256.4 | 152.5 | 354.5 | 476.8 | |||
| 1990's | 412.7 | 384.6 | 397.6 | 395.0 | 523.7 | 778.3 | 1,196.8 | 1,261.4 | 1,521.8 | 911.1 |
| 2000's | 920.0 | 1,480.0 | 1,551.4 | 1,648.5 | 1,853.4 | 2,006.5 | 1,974.1 | 1,987.7 | 2,189.3 | 1,827.7 |
| 2010's | 1,553.3 | 1,588.0 | 2,751.4 | 2,930.9 | 3,066.2 | 3,287.3 | 3,491.5 | 3,605.6 | 3,538.3 | 3,483.4 |
| 2020's | 1,744.3 |
| - = No Data Reported; -- = Not Applicable; NA = Not Available; W = Withheld to avoid disclosure of individual company data. |
| Release Date: 6/1/2022 |
| Next Release Date: TBD |