|
Download Data (XLS File) |
|
||||||||
|
||||||||
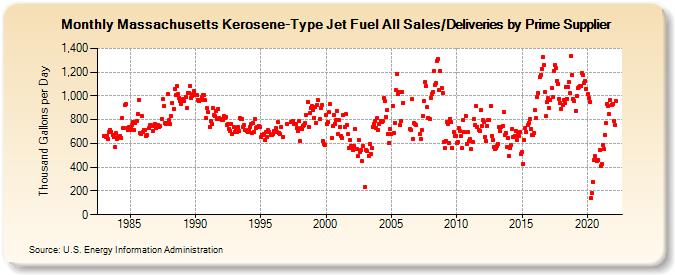
| Massachusetts Kerosene-Type Jet Fuel All Sales/Deliveries by Prime Supplier (Thousand Gallons per Day) | ||||||||
| Year | Jan | Feb | Mar | Apr | May | Jun | Jul | Aug | Sep | Oct | Nov | Dec |
|---|---|---|---|---|---|---|---|---|---|---|---|---|
| 1983 | 661.8 | 660.7 | 657.0 | 666.5 | 640.6 | 698.2 | 715.9 | 698.6 | 667.6 | 650.5 | 570.0 | 684.9 |
| 1984 | 637.8 | 653.2 | 656.5 | 665.8 | 649.4 | 812.4 | 732.1 | 921.2 | 932.4 | 731.7 | 709.3 | 734.2 |
| 1985 | 713.0 | 736.2 | 754.9 | 781.4 | 714.4 | 772.1 | 790.9 | 849.2 | 969.4 | 687.6 | 681.6 | 831.2 |
| 1986 | 693.3 | 716.9 | 715.5 | 665.7 | 667.4 | 727.2 | 752.8 | 752.2 | 747.2 | 706.8 | 748.1 | 761.6 |
| 1987 | 729.4 | 749.4 | 751.0 | 738.1 | 742.7 | 806.9 | 972.6 | 913.4 | 770.8 | 761.9 | 768.1 | 1,013.9 |
| 1988 | 794.5 | 760.9 | 831.3 | 936.3 | 893.5 | 1,061.2 | 1,007.6 | 1,080.5 | 1,012.1 | 983.9 | 959.0 | 932.6 |
| 1989 | 962.3 | 970.8 | 960.5 | 993.1 | 901.5 | 1,022.2 | 1,027.5 | 1,083.4 | 980.7 | 998.7 | 1,017.1 | 1,038.5 |
| 1990 | 1,010.3 | 1,008.8 | 966.0 | 957.5 | 968.9 | 961.5 | 989.5 | 1,011.4 | 1,007.1 | 961.7 | 810.3 | 900.5 |
| 1991 | 861.2 | 742.0 | 785.3 | 759.6 | 902.4 | 842.9 | 830.8 | 877.2 | 805.5 | 891.1 | 814.0 | 805.1 |
| 1992 | 801.0 | 796.8 | 830.0 | 814.9 | 824.1 | 759.1 | 760.1 | 724.6 | 705.4 | 760.3 | 681.9 | 735.0 |
| 1993 | 700.4 | 726.6 | 699.1 | 734.3 | 708.8 | 810.5 | 805.4 | 806.4 | 740.7 | 754.2 | 713.4 | 704.7 |
| 1994 | 693.3 | 716.0 | 737.5 | 762.2 | 692.0 | 772.1 | 697.6 | 802.9 | 726.6 | 735.8 | 750.7 | 740.7 |
| 1995 | 651.1 | 674.2 | 670.3 | 680.0 | 628.4 | 692.4 | 653.7 | 711.8 | 699.6 | 674.7 | 668.4 | 677.6 |
| 1996 | 703.5 | 705.9 | 725.8 | 694.5 | 777.5 | 688.0 | 677.7 | 739.1 | 652.0 | W | W | W |
| 1997 | 760.0 | W | W | W | 778.4 | 777.0 | 786.2 | 760.5 | 761.6 | 727.0 | 706.2 | 785.0 |
| 1998 | 618.4 | 732.2 | 722.3 | 743.3 | 752.5 | 769.6 | 842.5 | 947.4 | 742.2 | 853.4 | 900.1 | 914.5 |
| 1999 | 878.0 | 816.0 | 908.5 | 775.7 | 924.4 | 962.8 | 803.8 | 894.7 | 919.3 | 621.7 | 598.3 | 584.1 |
| 2000 | 839.6 | 765.8 | 776.7 | 860.7 | 928.5 | 645.6 | 746.6 | 835.5 | 767.3 | 796.9 | 875.3 | 676.1 |
| 2001 | 799.1 | 740.5 | 663.9 | 647.8 | 835.3 | 738.8 | 844.8 | 758.5 | 678.7 | 565.7 | 632.7 | 581.0 |
| 2002 | 560.3 | 543.1 | 574.9 | 718.1 | 552.0 | 492.0 | 630.4 | 530.2 | 540.9 | 452.3 | 577.4 | W |
| 2003 | 233.8 | 546.5 | 532.4 | 495.5 | 596.7 | 514.4 | 564.1 | 741.1 | 759.6 | 792.3 | 730.1 | 816.0 |
| 2004 | 715.5 | 761.0 | 791.5 | 779.5 | 788.8 | 978.3 | 958.8 | 825.6 | 881.9 | 677.2 | 606.9 | 724.9 |
| 2005 | 676.7 | 918.9 | 687.0 | 774.6 | 1,051.4 | 1,187.1 | 1,014.9 | 1,032.6 | 753.8 | 789.1 | 1,031.9 | 944.0 |
| 2006 | W | W | NA | NA | NA | 723.2 | 710.4 | 971.6 | 639.5 | 770.3 | 760.9 | 752.5 |
| 2007 | NA | NA | 681.4 | 640.0 | 709.0 | 834.7 | 960.3 | 1,115.0 | 1,080.6 | 904.6 | 817.9 | 802.1 |
| 2008 | 985.1 | 1,017.0 | 1,034.1 | 1,212.3 | 1,095.6 | 1,106.2 | 1,297.8 | 1,306.8 | 1,045.6 | 1,211.5 | 1,069.7 | 1,027.0 |
| 2009 | 608.6 | 562.2 | 619.9 | 776.2 | 766.5 | 604.3 | 809.1 | 776.5 | 561.4 | 692.4 | 662.8 | 665.6 |
| 2010 | 602.9 | 613.7 | 728.2 | 706.1 | 660.7 | 558.2 | 798.0 | 692.1 | 833.3 | 599.4 | 693.9 | 617.0 |
| 2011 | 634.2 | 551.8 | NA | 610.0 | 803.0 | 757.7 | 911.9 | 742.2 | 713.0 | 703.9 | 880.4 | 747.5 |
| 2012 | 794.0 | 777.8 | 653.4 | 617.5 | 750.2 | 793.5 | 800.3 | 914.5 | 664.4 | 626.8 | 572.2 | 555.6 |
| 2013 | 562.7 | 579.9 | 598.9 | 738.4 | 705.5 | 738.7 | 743.0 | 863.8 | 670.3 | 690.6 | 572.8 | 648.9 |
| 2014 | 490.8 | 563.5 | 583.5 | 722.2 | 654.4 | 664.2 | 704.4 | 628.1 | 680.5 | 664.4 | 693.7 | 507.6 |
| 2015 | 531.8 | 429.8 | 631.5 | 731.0 | 696.0 | 751.7 | 770.8 | 801.7 | 724.1 | 669.3 | 666.8 | 688.3 |
| 2016 | 879.3 | 810.9 | 991.2 | 1,026.9 | 1,155.5 | 1,177.0 | 1,229.3 | 1,325.3 | 1,263.1 | 1,033.2 | 827.2 | 944.8 |
| 2017 | 978.7 | 895.4 | 963.1 | 1,062.4 | 987.0 | 1,213.7 | 1,259.1 | 1,233.7 | 1,126.4 | 1,104.1 | 977.8 | 936.2 |
| 2018 | 892.9 | 922.9 | 964.7 | 939.9 | 1,077.0 | 976.5 | 1,075.4 | 1,114.2 | 1,022.1 | 1,337.3 | 1,178.1 | 970.4 |
| 2019 | 957.5 | 873.1 | 1,001.8 | 1,065.4 | 1,076.5 | 1,081.3 | 1,081.4 | 1,191.7 | 1,175.9 | 1,110.9 | 1,123.4 | 1,060.6 |
| 2020 | 1,013.8 | 983.1 | 949.5 | 139.0 | 182.5 | 279.1 | 457.3 | 491.0 | 457.5 | 449.1 | 457.2 | 542.2 |
| 2021 | 406.9 | 425.0 | 588.1 | 554.9 | 670.3 | 771.0 | 931.1 | 917.0 | 844.2 | 967.5 | 927.7 | 935.6 |
| 2022 | 785.5 | 751.4 | 957.9 | |||||||||
| - = No Data Reported; -- = Not Applicable; NA = Not Available; W = Withheld to avoid disclosure of individual company data. |
| Release Date: 5/19/2022 |
| Next Release Date: TBD |