|
Download Data (XLS File) |
|
||||||||
|
||||||||
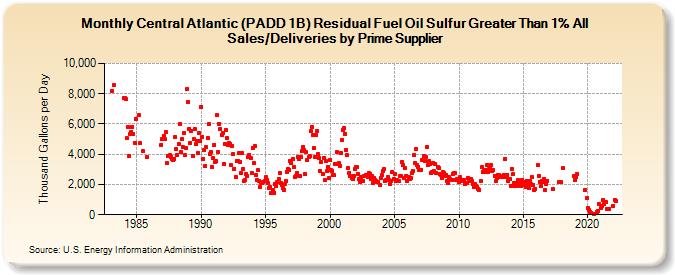
| Central Atlantic (PADD 1B) Residual Fuel Oil Sulfur Greater Than 1% All Sales/Deliveries by Prime Supplier (Thousand Gallons per Day) | ||||||||
| Year | Jan | Feb | Mar | Apr | May | Jun | Jul | Aug | Sep | Oct | Nov | Dec |
|---|---|---|---|---|---|---|---|---|---|---|---|---|
| 1983 | W | 8,207.6 | W | 8,554.2 | W | W | W | W | W | W | W | W |
| 1984 | 7,701.5 | 7,720.3 | 7,633.3 | 5,044.6 | 5,806.5 | 3,899.4 | 5,365.9 | 5,496.2 | 5,832.2 | 5,320.6 | 4,758.9 | 6,331.6 |
| 1985 | W | W | 6,582.9 | 4,718.1 | W | W | 4,186.0 | W | W | W | 3,814.5 | W |
| 1986 | W | W | W | W | W | W | W | W | W | W | W | 4,624.6 |
| 1987 | 5,025.8 | 5,219.4 | 4,985.8 | 5,464.9 | 3,407.9 | 3,880.2 | 3,877.7 | 3,926.2 | 3,842.2 | 3,711.8 | 3,617.6 | 3,708.8 |
| 1988 | 5,128.5 | 4,330.8 | 3,967.7 | 4,676.9 | 5,973.5 | 4,135.9 | 5,009.5 | 4,474.0 | 5,410.4 | 3,920.4 | 4,427.5 | 8,299.6 |
| 1989 | 7,442.0 | 5,688.5 | 4,727.3 | 5,524.0 | 3,893.9 | 5,001.2 | 5,637.2 | 4,665.9 | 4,891.7 | 4,068.9 | 5,433.6 | 4,885.8 |
| 1990 | 7,125.7 | 5,141.9 | 3,703.0 | 4,281.5 | 3,208.3 | 4,465.1 | 5,076.8 | 5,981.3 | 4,019.0 | 4,127.7 | 3,150.9 | 3,747.0 |
| 1991 | 4,627.2 | 3,462.1 | 3,526.7 | 6,594.7 | 4,174.3 | 6,017.0 | 5,688.5 | 5,282.9 | 5,388.1 | 3,332.0 | 4,697.7 | 5,632.6 |
| 1992 | 5,049.4 | 4,582.0 | 4,766.4 | 4,672.1 | 3,267.6 | 4,539.5 | 3,992.9 | 3,048.9 | 2,465.7 | 3,536.4 | 3,570.4 | 4,075.7 |
| 1993 | 3,484.7 | 2,743.8 | 4,048.2 | 3,027.1 | 2,257.4 | 2,327.4 | 2,695.4 | 2,546.8 | 3,792.1 | 3,964.0 | 3,737.8 | 2,777.5 |
| 1994 | 4,430.7 | 3,433.0 | 4,531.1 | 2,630.1 | 2,276.5 | 2,930.2 | 2,261.3 | 1,834.7 | 2,111.7 | 2,078.2 | 2,132.7 | 2,226.4 |
| 1995 | 2,466.5 | 2,293.9 | 2,093.2 | 1,799.3 | 1,824.0 | 1,407.7 | 1,407.9 | 1,656.7 | 1,452.4 | 2,035.8 | 1,885.4 | 2,186.2 |
| 1996 | 2,349.7 | 2,742.2 | 2,074.1 | 1,960.1 | 1,739.8 | 1,653.5 | 2,063.0 | 2,213.3 | 2,830.9 | 3,008.3 | 2,960.0 | 3,559.8 |
| 1997 | 3,407.4 | 3,697.1 | 3,142.5 | 2,477.3 | 2,561.9 | 2,737.6 | 3,832.4 | 3,682.4 | 2,582.4 | 3,793.3 | 4,218.6 | 4,492.2 |
| 1998 | 4,303.1 | 2,673.3 | 4,123.6 | 3,612.3 | 3,822.5 | 3,871.8 | 5,534.1 | 5,828.7 | 5,295.1 | 4,398.9 | 3,815.6 | 5,267.9 |
| 1999 | 5,538.8 | 3,992.2 | 3,744.8 | 2,884.8 | 3,511.6 | 2,694.7 | 3,775.0 | 2,321.6 | 3,554.4 | 2,902.1 | 3,187.8 | 2,413.0 |
| 2000 | 3,613.9 | 2,954.4 | 2,898.0 | 2,598.5 | 2,601.4 | 3,336.1 | 4,144.4 | 3,351.0 | 3,386.9 | 3,235.5 | 4,078.6 | 4,966.5 |
| 2001 | 5,633.0 | 5,714.0 | 5,354.3 | 4,292.8 | 3,927.0 | 3,067.3 | 2,764.5 | 2,530.4 | 2,448.6 | 2,384.2 | 2,584.7 | 3,038.2 |
| 2002 | 3,161.8 | 3,137.6 | 2,700.5 | 2,381.9 | 2,179.7 | 2,486.6 | 2,259.9 | 2,226.7 | 2,579.9 | 2,610.2 | 2,650.9 | 2,506.4 |
| 2003 | 2,738.6 | 2,710.6 | 2,341.1 | 2,591.2 | 2,083.5 | 2,442.3 | 2,311.5 | 2,262.2 | 2,131.5 | 2,178.8 | 1,950.0 | 2,395.3 |
| 2004 | 2,613.0 | 2,912.3 | 2,993.3 | 2,232.9 | 2,269.6 | 2,305.0 | 2,489.0 | 2,289.8 | 2,005.9 | 2,261.4 | 2,856.2 | 2,372.2 |
| 2005 | 2,715.2 | 2,204.5 | 2,326.7 | 2,237.9 | 2,205.1 | 2,527.2 | 2,586.6 | 3,489.8 | 3,275.9 | 2,416.7 | 3,060.3 | 2,561.8 |
| 2006 | 2,244.5 | 2,498.5 | 2,345.8 | 2,403.1 | 2,760.6 | 2,905.0 | 3,956.7 | 3,427.0 | 4,327.7 | 3,270.5 | 3,173.8 | 2,939.9 |
| 2007 | 2,932.7 | 2,960.1 | 3,601.0 | 3,872.0 | 3,573.7 | 3,835.8 | 4,497.8 | 3,270.6 | 3,533.3 | 3,351.1 | 2,780.9 | 2,791.6 |
| 2008 | 3,432.2 | 2,871.3 | 3,362.5 | 2,768.9 | 3,187.1 | 3,112.7 | 2,706.3 | 2,655.6 | 2,430.5 | 2,815.3 | 2,735.7 | 2,537.1 |
| 2009 | 2,630.2 | 2,236.0 | 2,092.5 | 2,478.5 | 2,339.0 | 2,313.5 | 2,724.4 | 2,739.5 | 2,734.2 | 2,315.5 | 2,369.9 | 2,362.5 |
| 2010 | 2,160.9 | 2,483.4 | 2,246.5 | 2,227.3 | 2,283.5 | 2,300.9 | 2,005.7 | 2,082.1 | 2,428.1 | 2,344.4 | 2,223.5 | 2,331.5 |
| 2011 | 2,261.7 | 2,014.8 | 1,825.6 | 2,021.7 | 1,921.6 | 1,803.3 | 1,721.5 | 1,664.2 | 2,208.6 | 3,133.2 | 2,829.5 | 2,980.8 |
| 2012 | 2,853.3 | 2,959.7 | 3,310.9 | 2,847.8 | 3,004.5 | 3,106.8 | 3,256.6 | 2,895.4 | 2,936.6 | 2,591.1 | 2,238.4 | 2,397.8 |
| 2013 | 2,650.7 | 2,610.8 | 2,579.0 | 2,481.9 | 2,514.3 | 2,521.7 | 2,649.8 | 3,695.3 | 2,510.7 | 2,637.9 | 2,216.2 | 2,388.5 |
| 2014 | 1,881.2 | 3,025.9 | 2,669.3 | 2,086.8 | 1,874.0 | 2,110.4 | 1,884.3 | 2,265.8 | 1,969.3 | 2,083.7 | 1,931.5 | 2,268.1 |
| 2015 | 2,133.8 | 1,957.3 | 1,861.3 | 2,247.5 | 2,057.6 | 1,736.6 | 2,209.1 | 2,004.6 | 2,496.5 | 1,970.6 | 1,608.1 | 1,703.1 |
| 2016 | W | 3,255.7 | 2,578.5 | 2,164.1 | 1,880.5 | 2,249.3 | 2,135.1 | 2,374.9 | 1,654.9 | 2,011.4 | 2,255.7 | W |
| 2017 | W | W | W | 1,704.0 | W | W | W | W | W | 2,159.2 | W | 2,144.5 |
| 2018 | W | 3,065.1 | W | W | W | W | W | W | W | W | W | 2,562.5 |
| 2019 | 2,287.0 | 2,492.3 | 2,695.0 | W | W | W | W | W | W | 1,605.5 | W | 1,089.5 |
| 2020 | 472.0 | 307.7 | 163.2 | 144.8 | W | W | 73.8 | W | 202.0 | 268.6 | 713.9 | W |
| 2021 | 449.4 | 551.7 | 965.5 | 717.6 | 814.8 | 824.4 | 375.0 | W | 384.0 | W | W | 585.9 |
| 2022 | W | 1,002.7 | 924.3 | |||||||||
| - = No Data Reported; -- = Not Applicable; NA = Not Available; W = Withheld to avoid disclosure of individual company data. |
| Release Date: 5/19/2022 |
| Next Release Date: TBD |